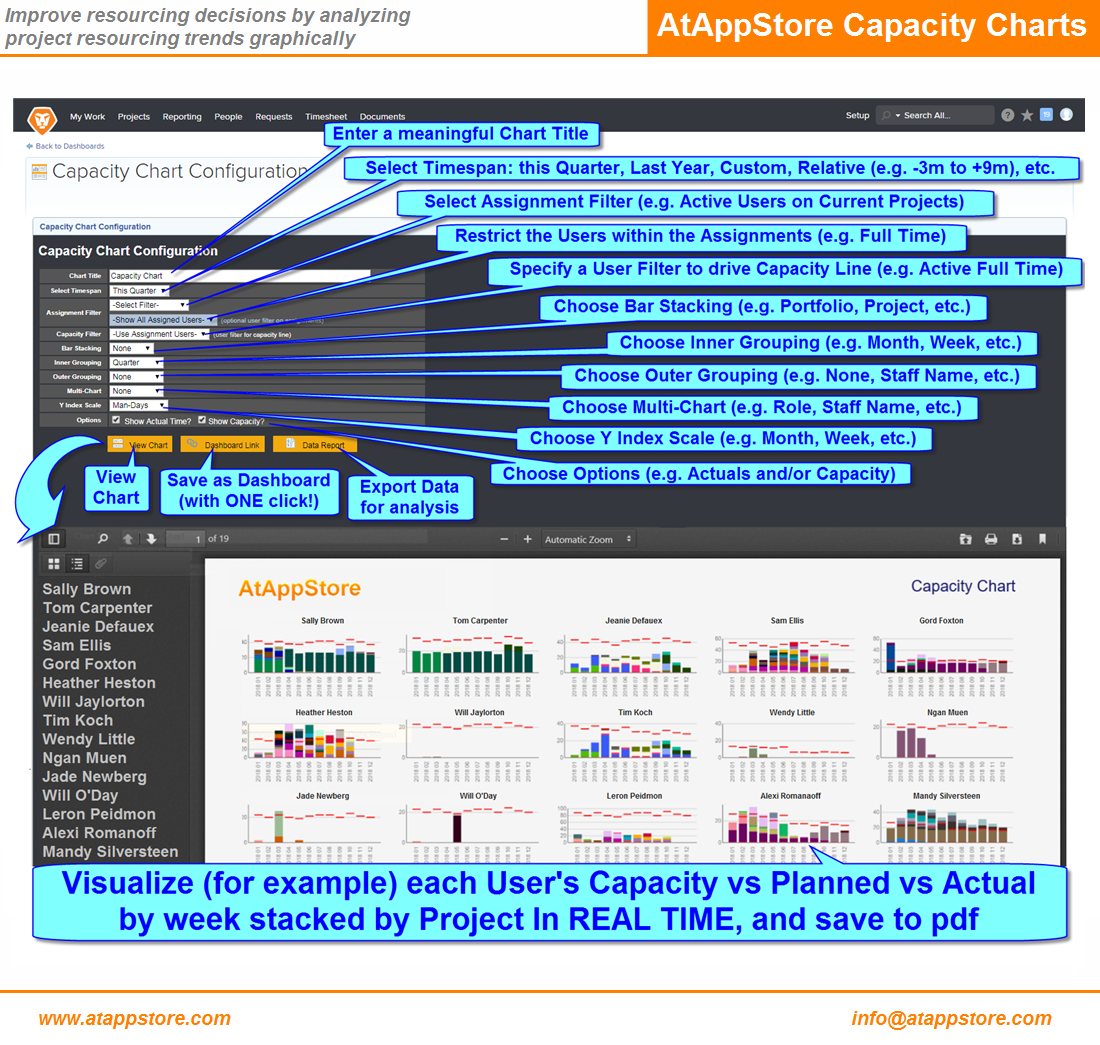
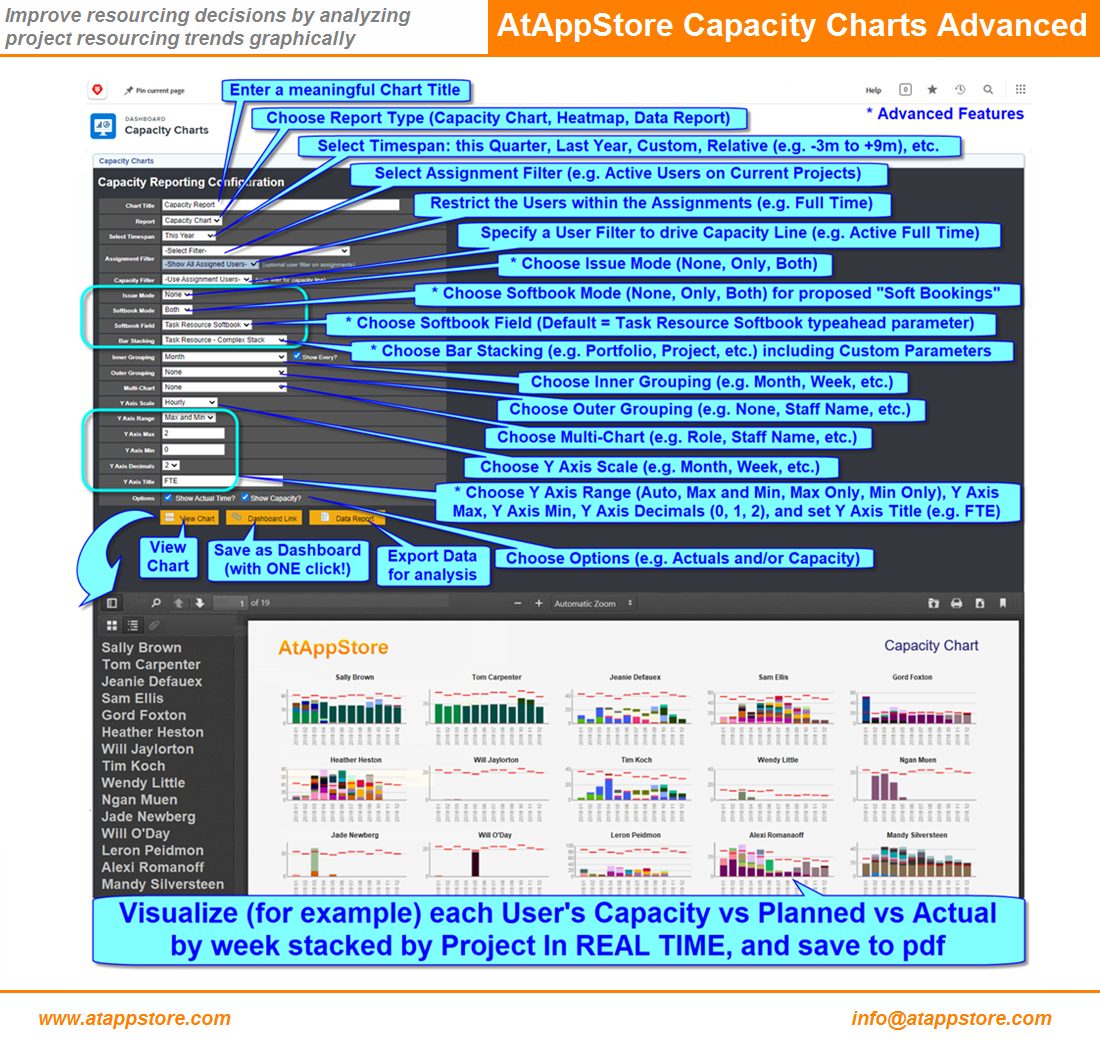
Capacity Charts

Our Capacity Charts solution can provide you real value as early as possible by allowing you to easily create insightful resource management reports with only basic Workfront setup, maximizing your benefits and ROI.

HOWAnnual License, Glossy, Video
WHATActuals, Reporting, Resourcing
WHENSince 2017
WHERECustom Data, Hours, Issues, Portfolios, Programs, Projects, Roles, Tasks, Users
WHOExecutive, Planner, Worker
WHYEmbedded, Simplification

  1. Solution
    Product Intro Slide
    capacity charting

    Capacity Charts

    Assess and
    Control Resourcing

    Our Capacity Charts solution can provide you real value as early as possible by allowing you to easily create insightful resource management reports with only basic Workfront setup, maximizing your benefits and ROI.

    Image slide #1
    Image slide #2
    Video Slide #1
    Price Slide

    Capacity Charts

    From
    $12,499/Year

    Standard version, Unlimited Use,

    From $24,999/Year
    Advanced version, Unlimited Use, or
    From $2,999/Year
    Plug-in version, Limited Use to our Resource Contouring solution

    previous arrowprevious arrow
    next arrownext arrow
    PlayPause


    Capacity Charts

     
    • Use the slider above to learn about this Solution's functionality
    • Review the More Details section below to understand how to use it
    • Consider the Pricing section and its value to you (noting payment comes later)
    • When you are ready to proceed, click the button above
     

    MORE DETAILS…
    Top

    Our Capacity Charts solution can provide you real value as early as possible by allowing you to easily create insightful resource management reports with only basic Workfront setup, maximizing your benefits and ROI.

    To use it…

    With the following minimal Workfront information in place:

    • Users
    • Schedules
    • Roles
    • Tasks
    • (Optional) Personal Time Off

    You can then configure highly customizable stacked charts to visualize changes in capacity vs planned vs actual project information over various time ranges. You can save chart (or data grid) as a Workfront dashboard with a single click, and then share it to those users who need access using standard Workfront sharing and layout template methods, building out an unlimited suite of business intelligence.

    We invite you to open the Media tab below and review the screen shot illustrating the basic functionality of our Standard version, then compare it against the next screen shot of our Advanced version, which includes all of the features in the Standard version plus:

    • Choose Issue Mode (None, Only, Both) if your organization sets planned hours against Issues and assigns them to Users (or Roles) for completion, so that those hours can then properly be accounted for when reviewing our Capacity Charts
    • Choose Softbook Mode (None, Only, Both) for proposed “Soft Bookings”, our new concept to address an old challenge of tentatively assigning the desired person against a Task (via a special Task-level “Softbook Field” typeahead user parameter) so that the invariable over-bookings can be visualized when reviewing our Capacity Charts and you can then prioritize and adjust as needed to then make the “real” assignments
    • Choose Softbook Field (with a “Task Resource Softbook” user typeahead parameter being our default, but allowing you the opportunity to create, populate, and choose from multiple such parameters, in order to model “alternative” Soft Bookings)
    • Our Bar Stacking (along with Inner Groupings and Outer Groupings) can optionally be configured to include your own Custom Parameters (e.g. on your Projects, Tasks, Issues, or Users) in order to gain even further insight on our Capacity Charts
    • Choose Y Axis Range (Auto, Max and Min, Max Only, Min Only), Y Axis Max, Y Axis Min, Y Axis Decimals (0, 1, 2), and set Y Axis Title (e.g. FTE), noting that “forcing” a particular Y Axis Range makes a dramatic impact on the value of our Capacity Charts, since — at a glance — you can easily spot the relative magnitude of each thumbnail chart relative to its peers

    PRICING
    Top

    From $12,499/Year (Standard version, unlimited use), or
    From $24,999/Year (Advanced version, unlimited use), or
    From $2,999/Year (Plug-in version, limited use) to our Resource Contouring solution

    Additional Bar Stacking fields configured to your Project, Task, Issue, or User custom parameters are optionally available to those licensing our Advanced version for a fixed fee of 4 hours per custom parameter.

    Your first year’s annual license of our Capacity Charts solution includes up to four hours for branding, installation, and training. And because it’s based on our Magic Reports technology, if you’d like us to tailor it to suit your needs exactly, we’d be happy to discuss a fixed quote to do so.

    Optionally, you may also choose to start with a one month paid trial for $4,999, which includes the above four hours for branding, installation, and training. That amount is non-refundable, but should you decide to proceed with an annual license before the trial ends, we will then apply it as a credit against your first year’s annual license.


    Other Resourcing Solutions…

    Resourcing solutions include Portfolios, Programs, Projects, Tasks, Issues, Hours, Schedules, and Roles, and help you understand and manage the ever-changing “work vs availability” challenges

    Top


    AFA Burn Check

    AFA Burn Check

    Prepare to
    Manage Margins

    AFA Burn List

    AFA Burn List

    Manage High
    Level Margins

    AFA Burn Report with Baseline+

    AFA Burn Report with Baselineᐩ

    Manage
    Detailed Margins

    Assign Resources
    assign resources

    Assign Resources

    Optimize Availability

    Assign Roles
    assign roles

    Assign Roles

    Refine Skill Requirements

    Baseline+

    Baselineᐩ

    Enrich Margin Data

    Capacity Charts
    capacity charting

    Capacity Charts

    Assess and
    Control Resourcing

    Create Baselines

    Capture Progress

    Editorial Calendar
    Editorial Calendar

    Editorial Calendar

    Visualize Assets

    Enterprise Stopwatch
    enterprise stopwatch

    Enterprise Stopwatch

    Track Time

    Estimate/Invoice
    estimate

    Estimate/Invoice

    Consolidate Plans

    Executive Status Report
    executive status report

    Executive Status Report

    Convey
    the Real Story

    Heatmap
    project heatmap

    Heatmap

    Reveal Constraints

    Hot Sheet
    hot sheet

    Hot Sheet

    Highlight Priorities

    JITR
    just in time resourcing

    JITR

    Apply Just In Time Resourcing

    Lite-Brite

    Lite-Brite

    Manage Expertly

    Magic Reports
    magic reports

    Magic Reports

    Define
    Custom Reports

    Multi Baseline Report

    Multi Baseline Report

    Assess
    Baseline Drift

    Resource Grid
    Resource Contouring

    Resource Grid

    Manage Resources

    Roadmap

    Roadmap

    Configure Advanced Corporate Reporting

    SQLtoXLS
    sql to xls

    SQLtoXLS

    Pull Data to Excel

    Swimlane ADVANCED

    Swimlane ADVANCED

    Draw the Big Picture Your Way

    Timeline

    Timeline

    Trace Critical Paths

    Uber Timesheet

    UberTimesheet

    Simplify
    Time Tracking

    previous arrowprevious arrow
    next arrownext arrow
    PlayPause

  2. Related Products