Resource Grid
Manage Resources
Our Resource Grid solution lets you visualize and manage resources using rollup Hours by Day, Week, or Month with no “Special Math” required.

Our Resource Grid solution lets you visualize and manage resources using rollup Hours by Day, Week, or Month with no "Special Math" required.
| HOW | Annual License, Glossy |
| WHAT | Budgeting, Configuration, Reporting, Resourcing |
| WHEN | Since 2020 |
| WHERE | Hours, Issues, Other, Projects, Roles, Tasks, Users |
| WHO | Planner, Worker |
| WHY | Automation, Data Processing, Embedded, Simplification |
Our Resource Grid solution lets you visualize and manage resources using rollup Hours by Day, Week, or Month with no “Special Math” required.
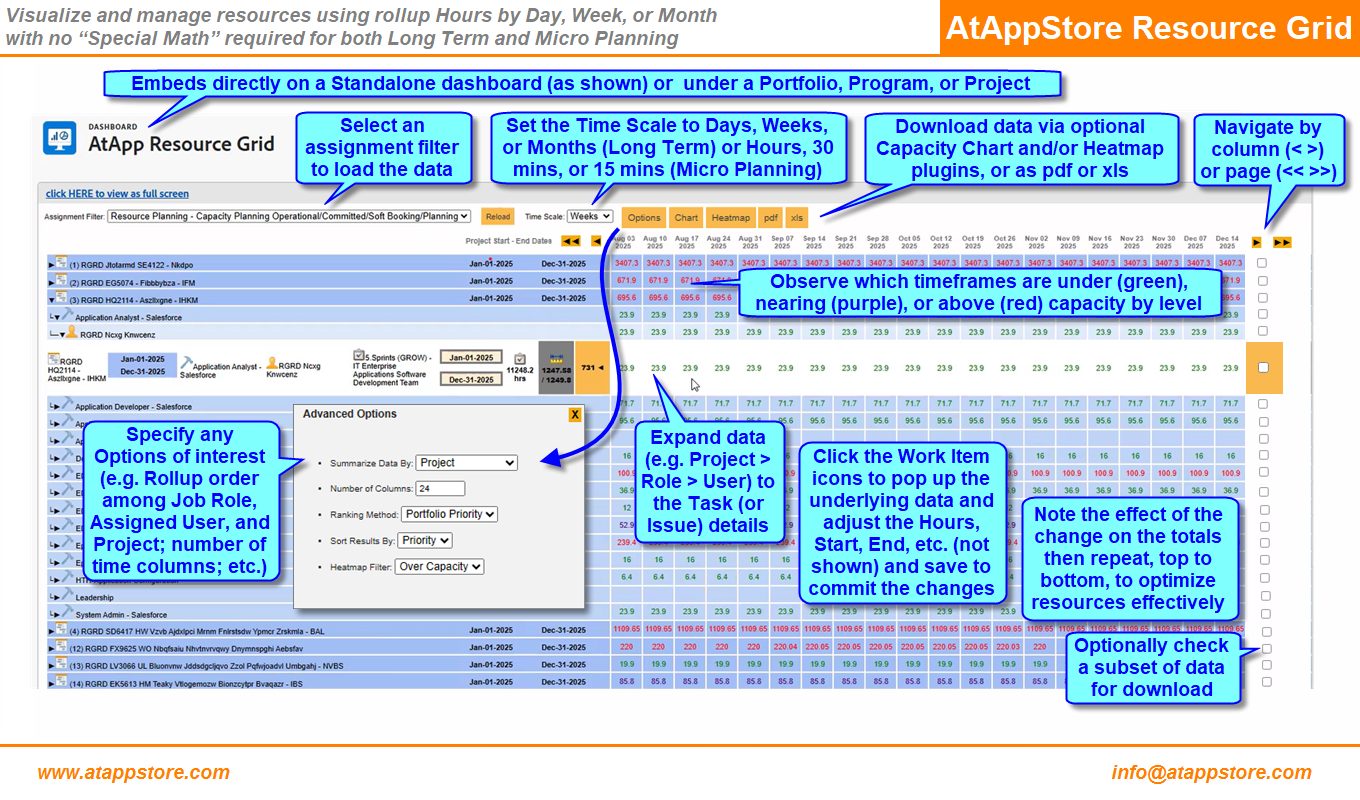
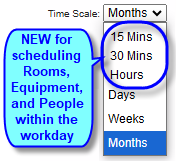
Our Resource Grid solution lets you visualize and manage resources using rollup Hours by Day, Week, or Month with no “Special Math” required for both Long Term and Micro Planning.
To use it…
By installing our Resource Grid solution, you can then:
As shown in the Media section below, our Resource Grid solution drastically simplifies the way you can visualize and manage your resources by highlighting both bottlenecks and opportunities.
All of the calculations take into account the underlying FTE’s percent-based Roles, schedules, and even their personal time off, then roll them properly into whichever among Days, Weeks, or Months is of most interest, and properly spread and account for those that cross into new weeks or months.
By tailoring your own Assignment Filters or simply navigating to the Portfolio, Program, or Project of interest, you can then easily create a grid, spreadsheet, and (with our optional plugins) Capacity Chart or Heatmap to confirm “what’s really in Workfront”, then take appropriate action at whatever Time Unit is most convenient for you.
If you are looking for an on-ramp into the valuable and exciting world of Resource and Capacity management within Workfront, we invite you to consider making our Resource Grid solution the Next Exit on your journey.
NOTE: due to underling technical changes within Workfront, we are unable to offer either our “right-click a Work Item to Add Contour (replacing the default flat distribution of time)” or our “adjust the Contour as desired (e.g. front load, create gaps, back load, etc.) in the selected Time Unit” at this time.
PRICING
Top
From $41,999/Year (unlimited use)
Additional $2,999/Year for our Capacity Charts Plugin (limited use)
Additional $1,999/Year for our Heatmap Plugin (limited use)
Your first year’s annual license of our Budget Vs Actual solution includes up to eight hours for branding, installation, and training. And because it’s based on our UberCalc technology, if you’d like us to tailor it to suit your needs exactly, we’d be happy to discuss a fixed quote to do so.
Other Resourcing Solutions…


Our Capacity Charts solution can provide you real value as early as possible by allowing you to easily create insightful resource management reports with only basic Workfront setup, maximizing your benefits and ROI.
| HOW | Annual License, Glossy, Video |
| WHAT | Actuals, Reporting, Resourcing |
| WHEN | Since 2017 |
| WHERE | Custom Data, Hours, Issues, Portfolios, Programs, Projects, Roles, Tasks, Users |
| WHO | Executive, Planner, Worker |
| WHY | Embedded, Simplification |

Our Heatmap solution offers you graphical, prioritized insight into which projects, roles, and users are covered, which ones are at risk, and which ones currently do not have adequate resourcing planned.
| HOW | Annual License, Glossy |
| WHAT | Reporting, Resourcing |
| WHEN | Since 2018 |
| WHERE | Custom Data, Hours, Issues, Portfolios, Programs, Projects, Roles, Tasks, Users |
| WHO | Executive, Planner, Worker |
| WHY | Embedded, Simplification |