
Heatmap
Reveal Constraints
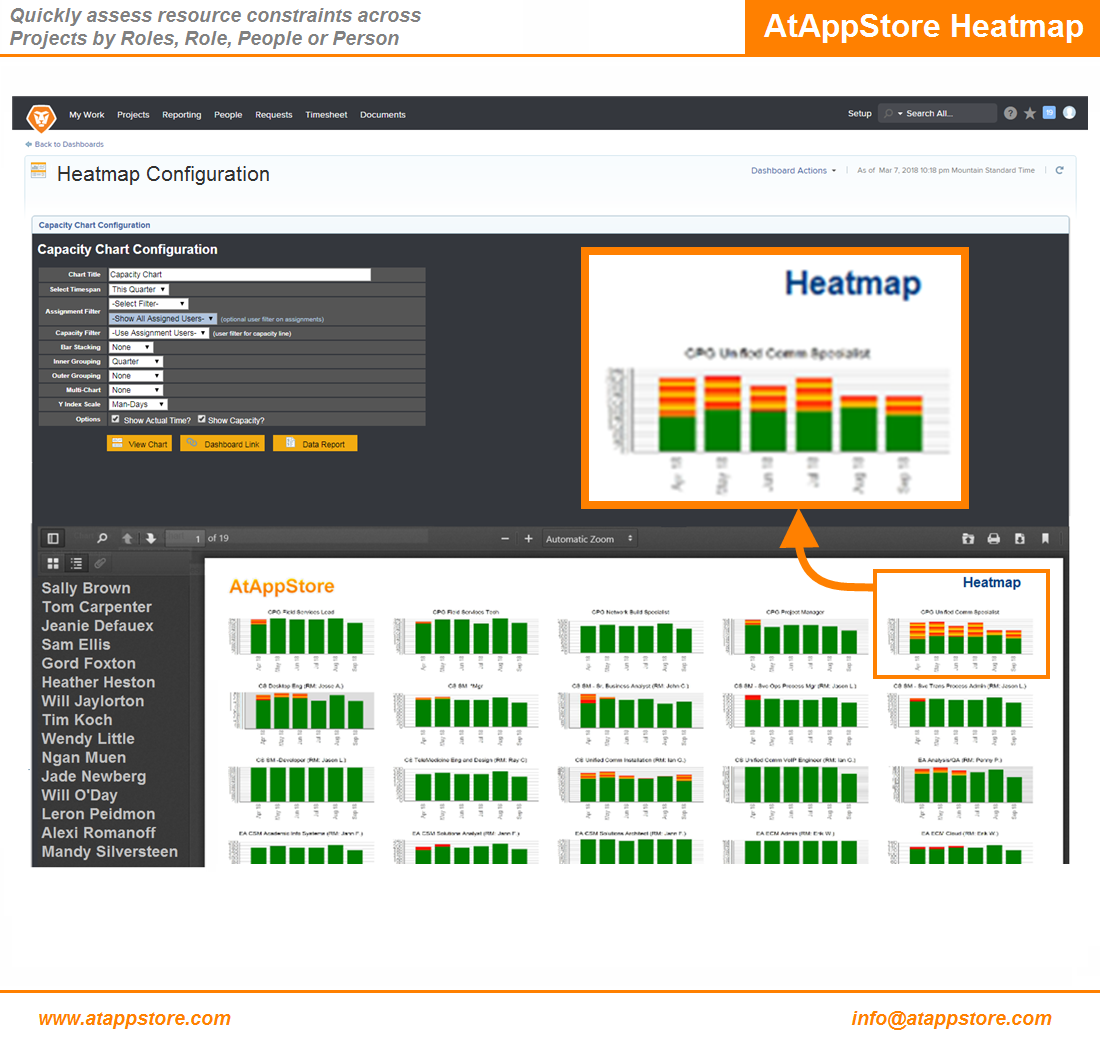
Our Heatmap solution offers you graphical, prioritized insight into which projects, roles, and users are covered, which ones are at risk, and which ones currently do not have adequate resourcing planned.

Our Heatmap solution offers you graphical, prioritized insight into which projects, roles, and users are covered, which ones are at risk, and which ones currently do not have adequate resourcing planned.
| HOW | Annual License, Glossy |
| WHAT | Reporting, Resourcing |
| WHEN | Since 2018 |
| WHERE | Custom Data, Hours, Issues, Portfolios, Programs, Projects, Roles, Tasks, Users |
| WHO | Executive, Planner, Worker |
| WHY | Embedded, Simplification |
Our Heatmap solution offers you graphical, prioritized insight into which projects, roles, and users are covered, which ones are at risk, and which ones currently do not have adequate resourcing planned.
Our Heatmap solution offers you graphical, prioritized insight into which projects, roles, and users are covered, which ones are at risk, and which ones currently do not have adequate resourcing planned.
To use it…
With the following minimal Workfront information in place:
You can then configure highly customizable stacked charts to visualize changes in capacity vs planned vs actual project information as “heat” over various time ranges. You can save chart (or data grid) as a Workfront dashboard with a single click, and then share it to those users who need access using standard Workfront sharing and layout template methods, building out an unlimited suite of business intelligence. Our annual license includes an unlimited number of report runs, and comes with up to four hours of coaching to teach you how to create your suite of Heatmaps and tailor them to your specific requirements.
PRICING
Top
From $5,999/Year (unlimited use)
Or $1,999/Year in (limited use) plugin mode with Resource Contouring
Your first year’s annual license of our Estimate solution includes up to four hours for branding, installation, and training. And because it’s based on our Magic Reports technology, if you’d like us to tailor it to suit your needs exactly, we’d be happy to discuss a fixed quote to do so.
Other Resourcing Solutions…


NOTE: our Capacity Charts solution is a prerequisite

Our Resource Grid solution lets you visualize and manage resources using rollup Hours by Day, Week, or Month with no "Special Math" required.
| HOW | Annual License, Glossy |
| WHAT | Budgeting, Configuration, Reporting, Resourcing |
| WHEN | Since 2020 |
| WHERE | Hours, Issues, Other, Projects, Roles, Tasks, Users |
| WHO | Planner, Worker |
| WHY | Automation, Data Processing, Embedded, Simplification |

Our Capacity Charts solution can provide you real value as early as possible by allowing you to easily create insightful resource management reports with only basic Workfront setup, maximizing your benefits and ROI.
| HOW | Annual License, Glossy, Video |
| WHAT | Actuals, Reporting, Resourcing |
| WHEN | Since 2017 |
| WHERE | Custom Data, Hours, Issues, Portfolios, Programs, Projects, Roles, Tasks, Users |
| WHO | Executive, Planner, Worker |
| WHY | Embedded, Simplification |
