
Swimlane ADVANCED
Draw the Big Picture Your Way
Our Swimlane ADVANCED solution lets you create Swimlane reports with customizable Panels, Timeframes, Swimlanes, Icons, Labels, and Colors

Our Swimlane ADVANCED solution lets you draw the Big Picture Your Way by creating Swimlane reports with customizable Panels, Timeframes, Swimlanes, Icons, Labels and Colors
| HOW | Annual License, Glossy, Video |
| WHAT | Actuals, Budgeting, Calendaring, Configuration, Reporting, Resourcing |
| WHEN | Since 2024 |
| WHERE | Custom Data, Other, Portfolios, Programs, Projects, Roles, Tasks, Users |
| WHO | Executive, Planner, Worker |
| WHY | Automation, Embedded, Simplification |
Our Swimlane ADVANCED solution lets you create Swimlane reports with customizable Panels, Timeframes, Swimlanes, Icons, Labels, and Colors
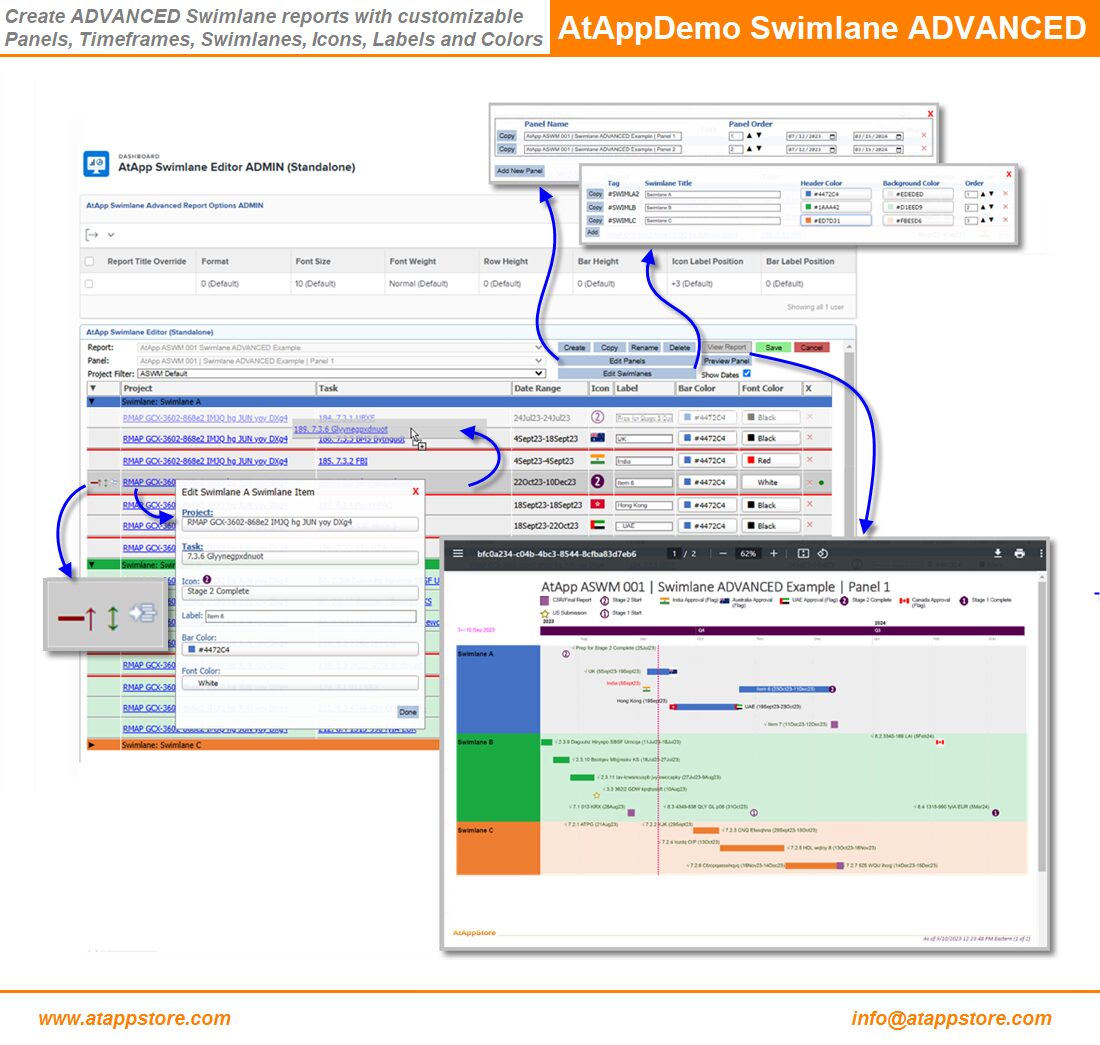
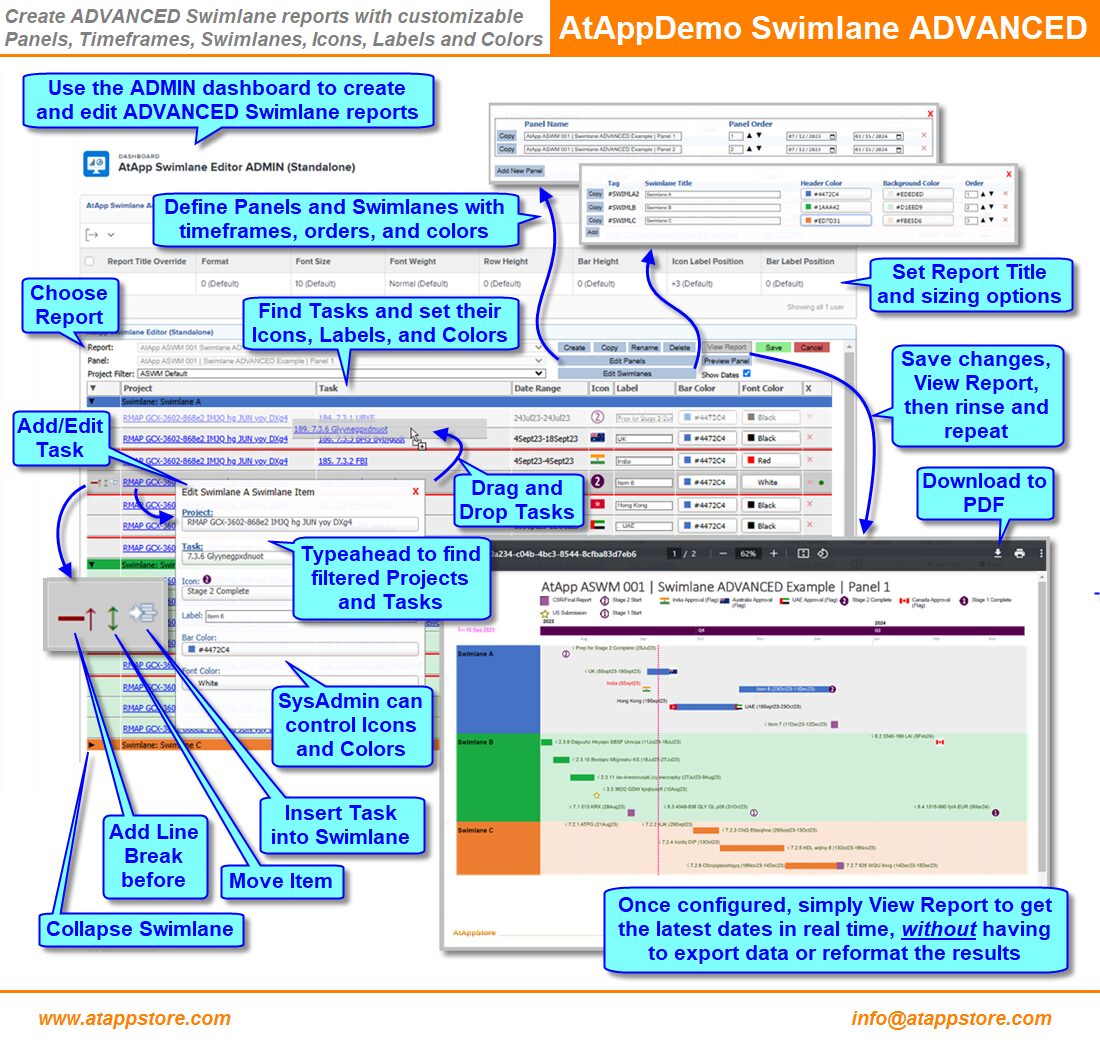
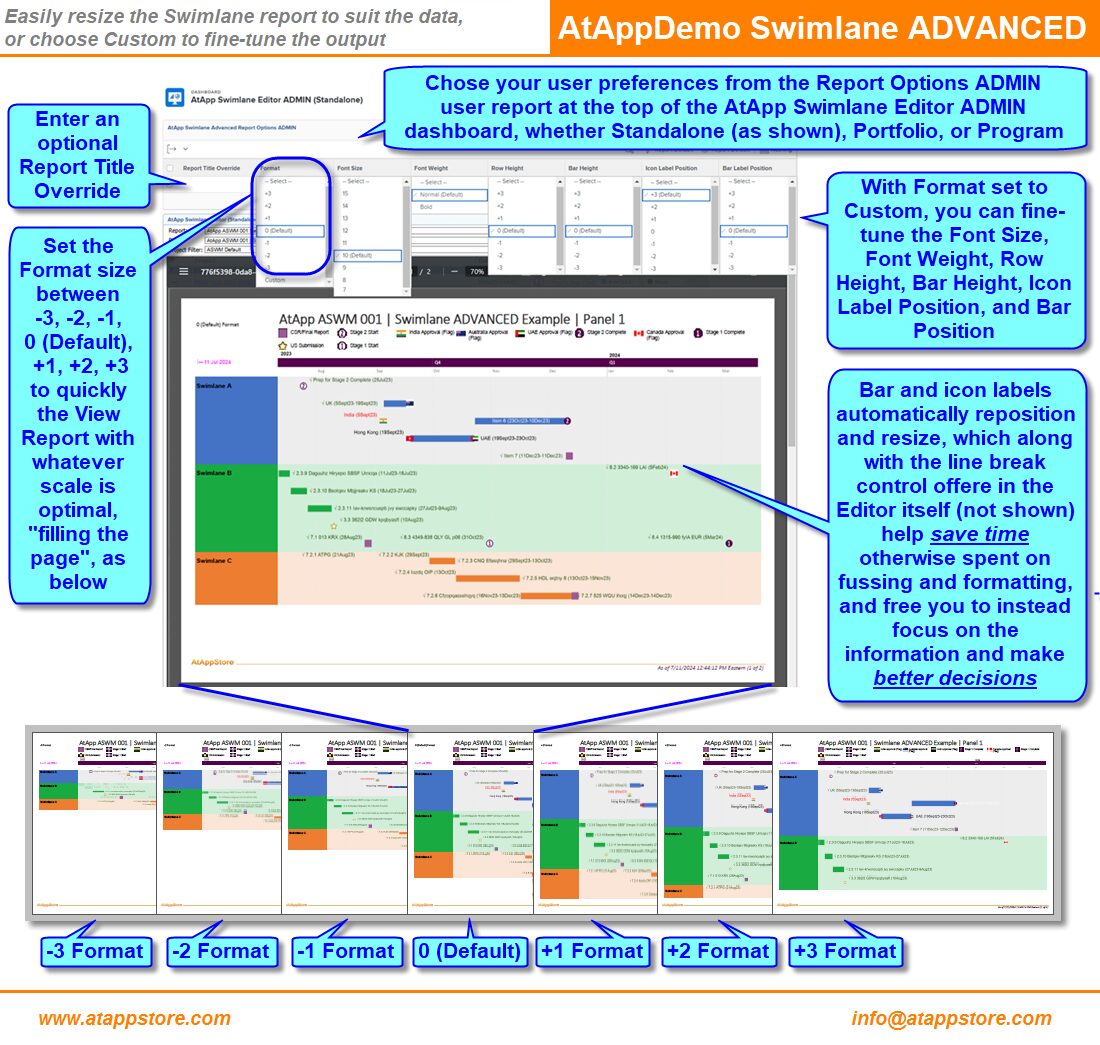


Our Swimlane ADVANCED solution lets you draw the Big Picture Your Way by creating Swimlane reports with customizable Panels, Timeframes, Swimlanes, Icons, Labels and Colors.
To use it…
By installing our Swimlane ADVANCED solution, as shown in the screen shots and video, it allows you to then:
If you choose to license our optional Smart Connector feature, you can also then:
Once configured, simply View Report to get the latest dates in real time, WITHOUT having to export data or reformat the results.
PRICING
Top
From $15,999/Year (unlimited use)
$3,999/Year for optional Smart Connector feature
Your first year’s annual license of our Swimlane ADVANCED solution includes up to eight hours for branding, installation, and training. And because it’s based on our Magic Reports technology, if you’d like us to tailor it to suit your needs exactly, we’d be happy to discuss a fixed quote to do so.
Optionally, you may also choose to start with a one month paid trial for $4,999, which includes the above eight hours for branding, installation, and training. That amount is non-refundable, but should you decide to proceed with an annual license before the trial ends, we will then apply it as a credit against your first year’s annual license.
Other Reporting Solutions…


