Multi Baseline Report
Assess
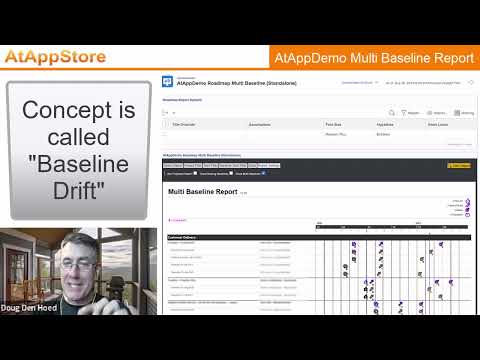
Baseline Drift
Our Multi Baseline Report solution lets you assess “Baseline Drift” by tagging Tasks with custom icons then filtering for Projects, Tasks, and Baselines of interest.

Our Multi Baseline Report solution lets you assess "Baseline Drift" by tagging Tasks with custom icons then filtering for Projects, Tasks, and Baselines of interest
| HOW | Annual License, Glossy, Video |
| WHAT | Actuals, Calendaring, Reporting, Resourcing |
| WHEN | Since 2023 |
| WHERE | Custom Data, Other, Portfolios, Programs, Projects, Tasks |
| WHO | Executive, Planner |
| WHY | Automation, Embedded, Simplification |
Our Multi Baseline Report solution lets you assess “Baseline Drift” by tagging Tasks with custom icons then filtering for Projects, Tasks, and Baselines of interest.
Our Multi Baseline Report solution lets you assess “Baseline Drift” by tagging Tasks with custom icons then filtering for Projects, Tasks, and Baselines of interest.
To use it…
By installing our Multi Baseline Report solution, as shown in the screen shots and video below it allows you to then:
PRICING
Top
From $5,999/Year (unlimited use)
Your first year’s annual license of our Multi Baseline Report solution includes up to eight hours for branding, installation, and training. And because it’s based on our Magic Reports technology, if you’d like us to tailor it to suit your needs exactly, we’d be happy to discuss a fixed quote to do so.
Optionally, you may also choose to start with a one month paid trial for $2,999, which includes the above eight hours for branding, installation, and training. That amount is non-refundable, but should you decide to proceed with an annual license before the trial ends, we will then apply it as a credit against your first year’s annual license.
Other Calendaring Solutions…