Budget Vs Actual Quarterly Burn
Manage Budgets by Quarter
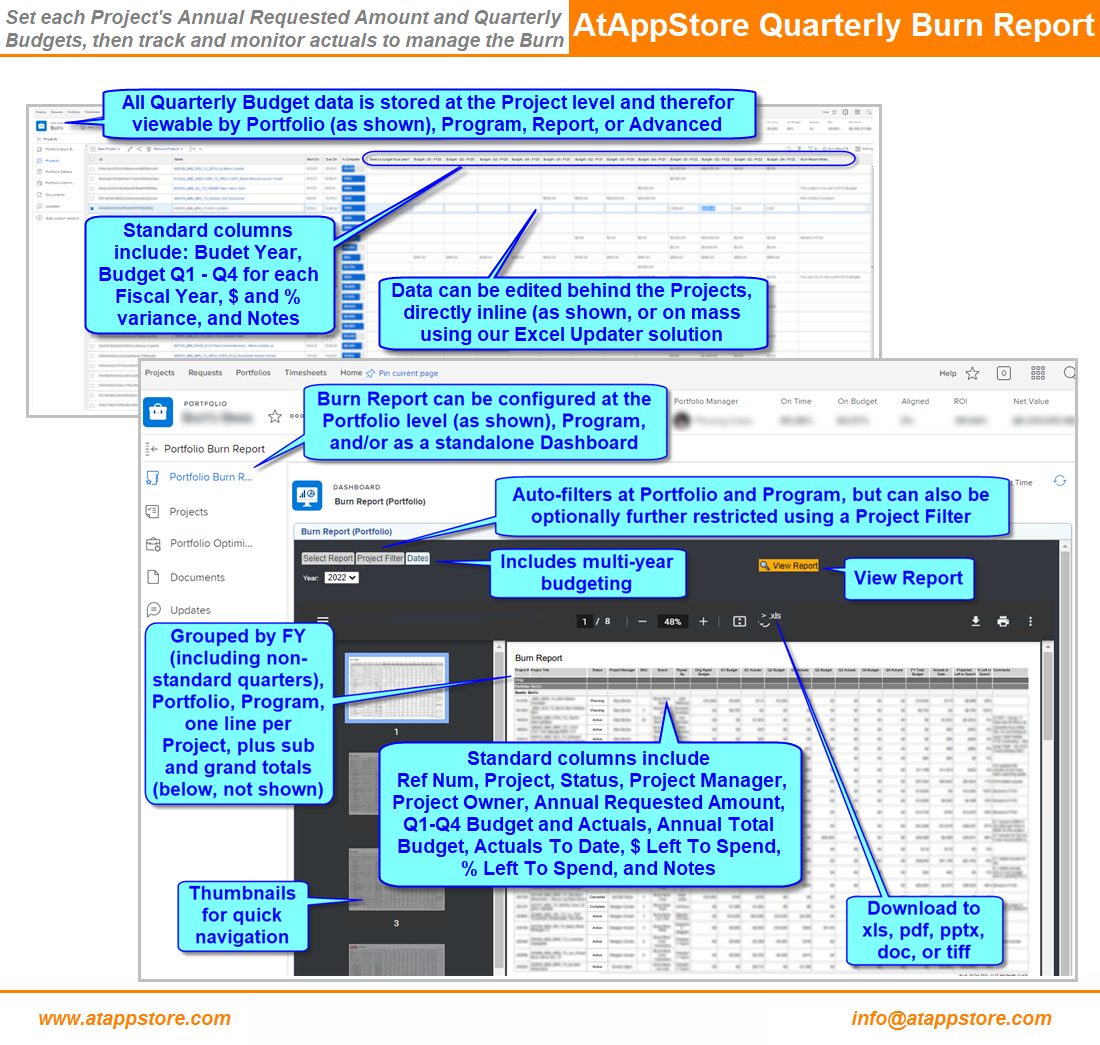
Our Budget vs Actual Quarterly Burn solution lets you set each Project’s Annual Requested Amount and Quarterly Budgets, then track and monitor actuals to manage the quarterly dollars and % Burn.