Magic Reports
Define
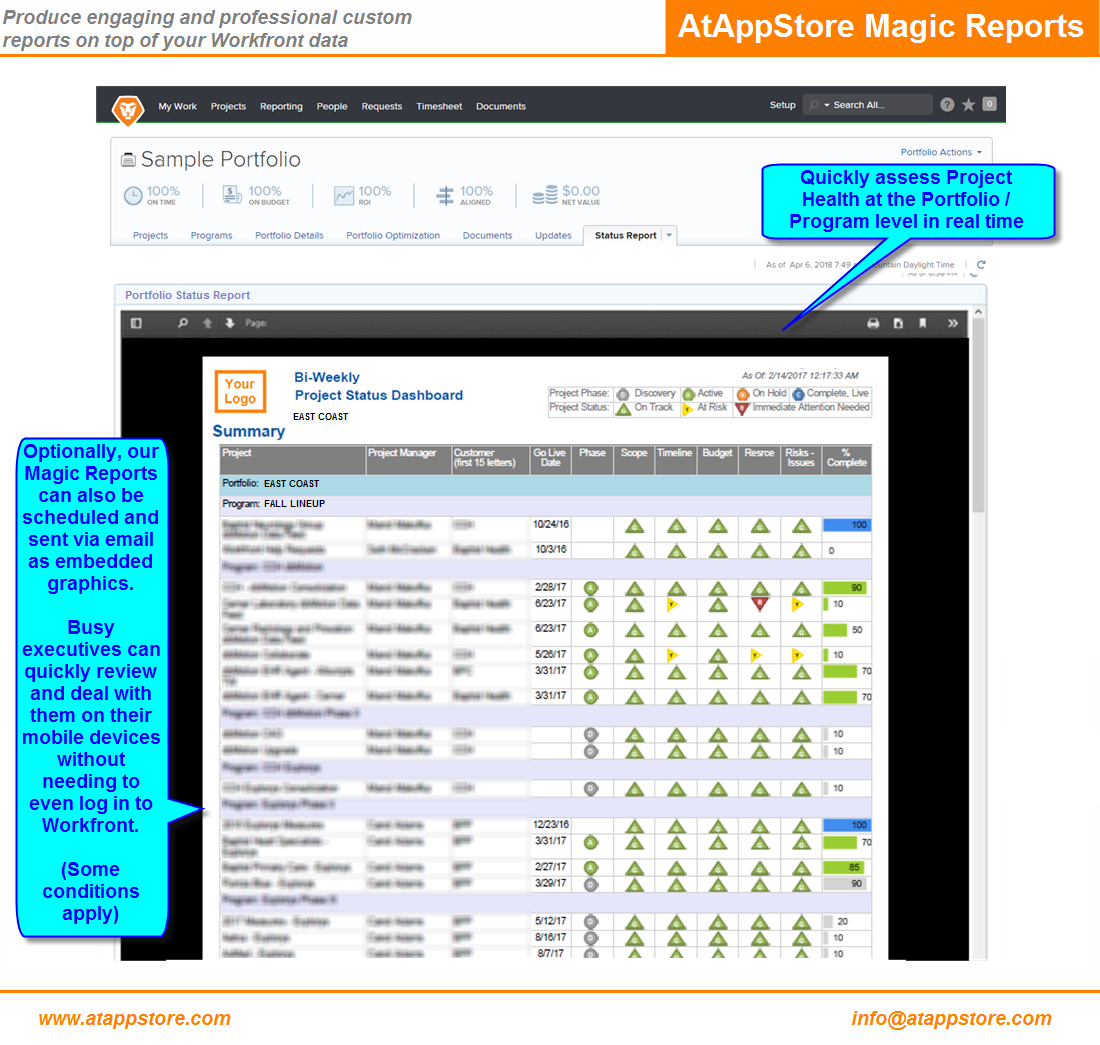
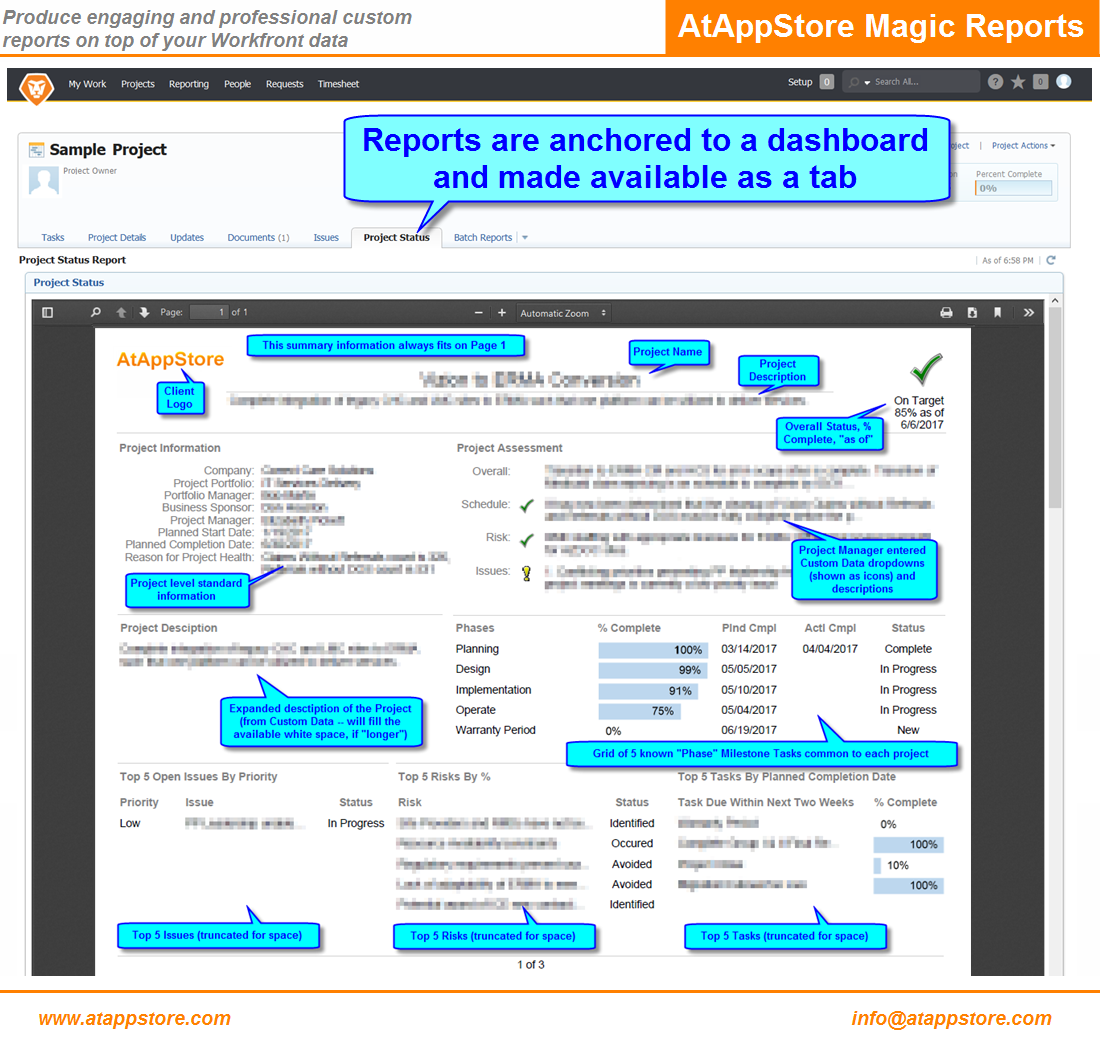
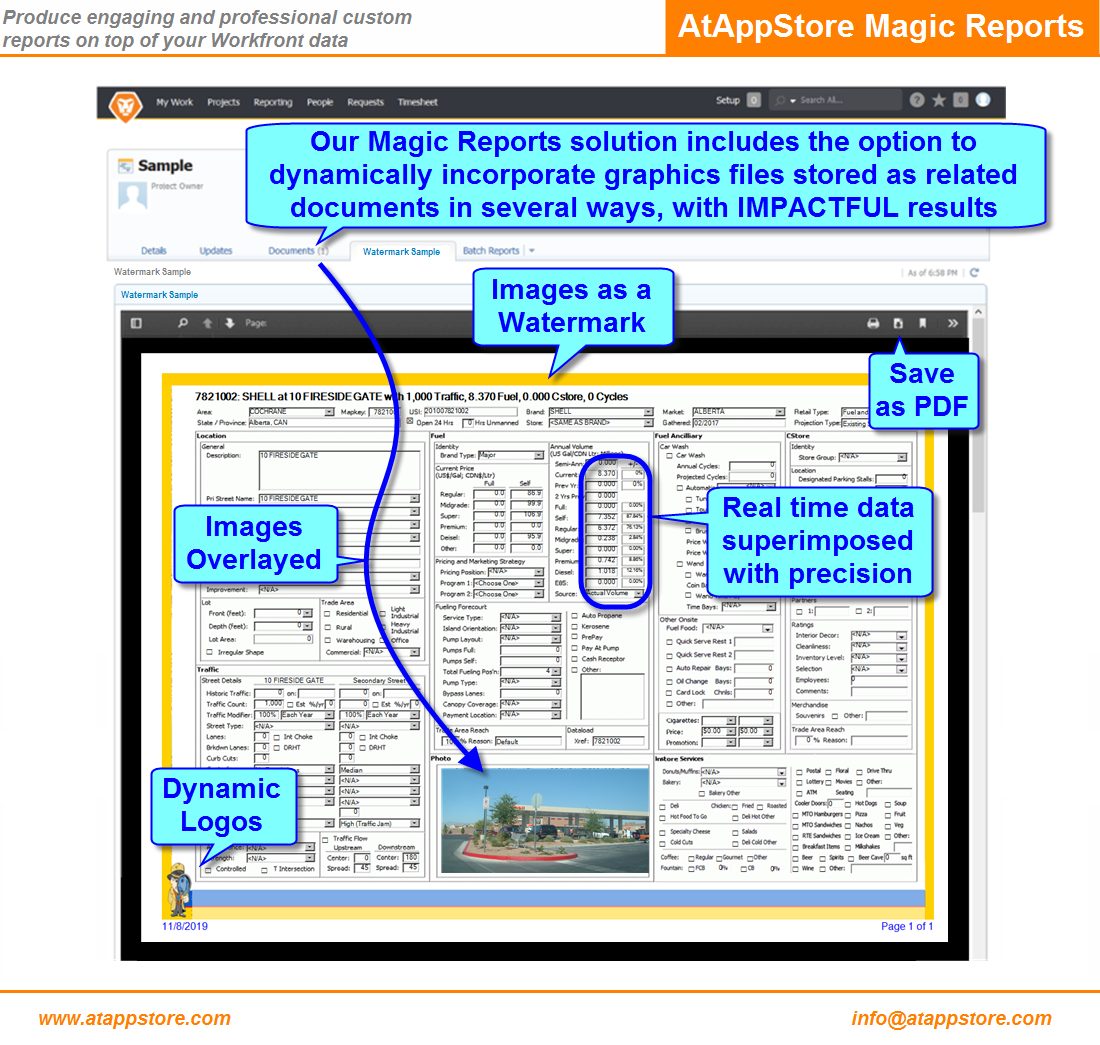
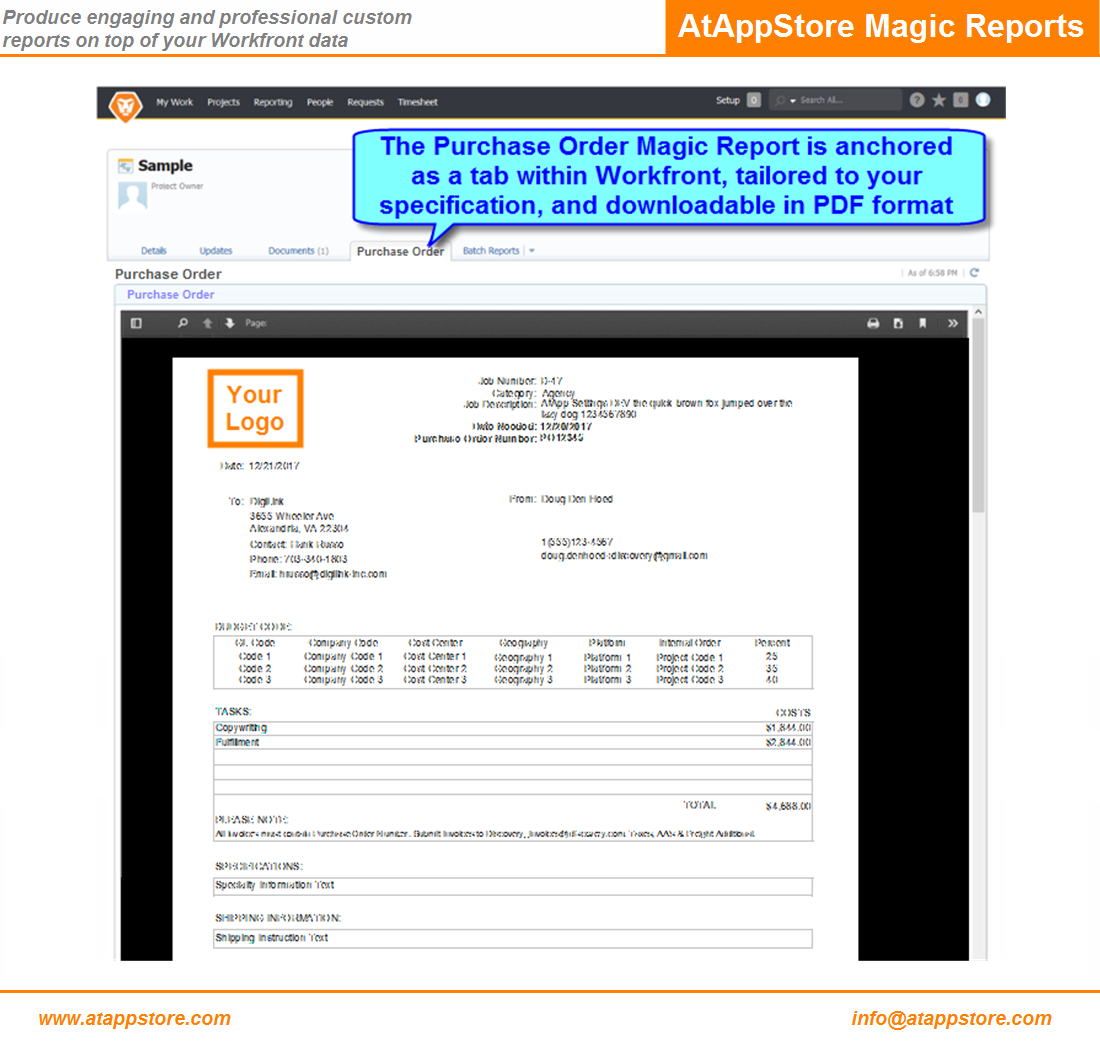
Custom Reports
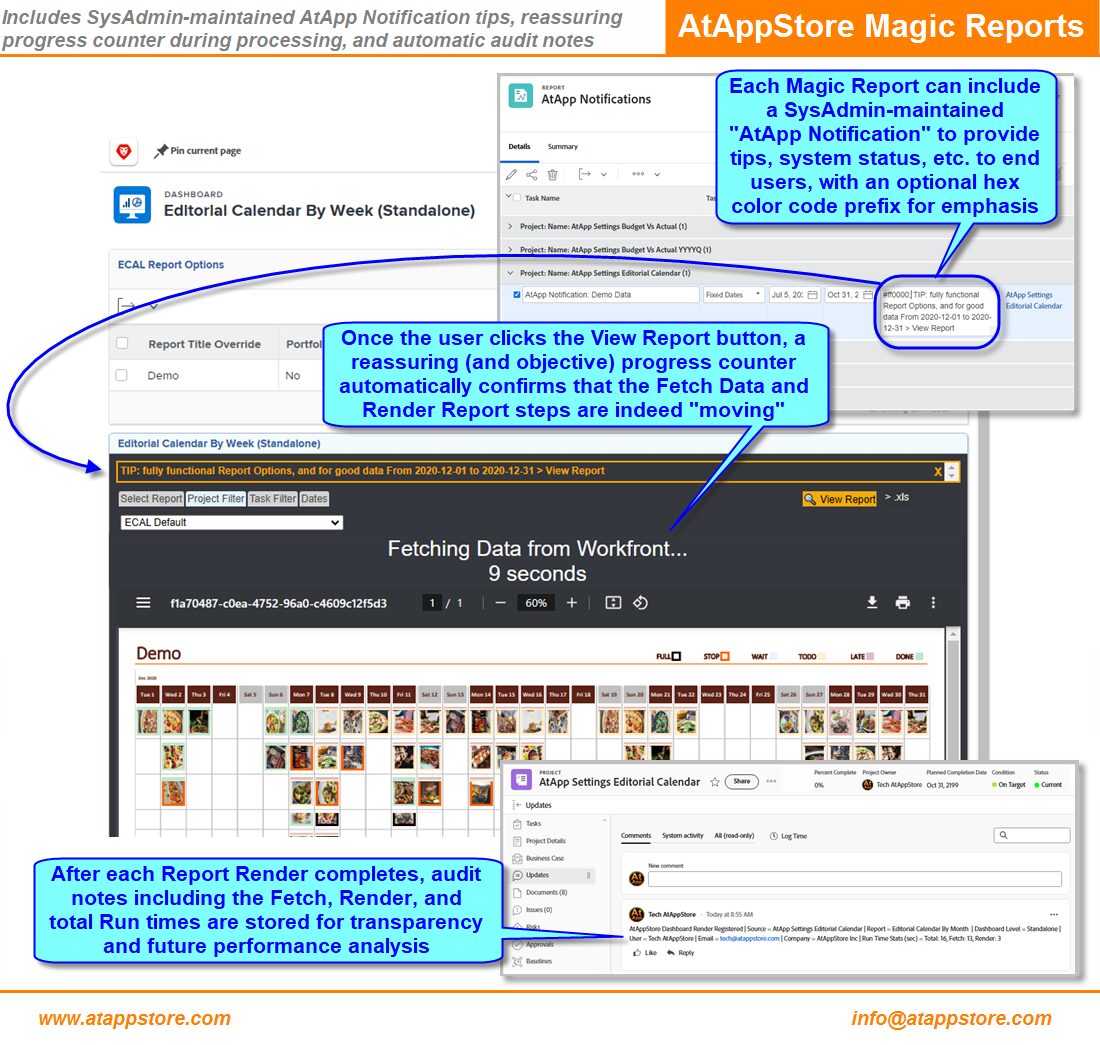
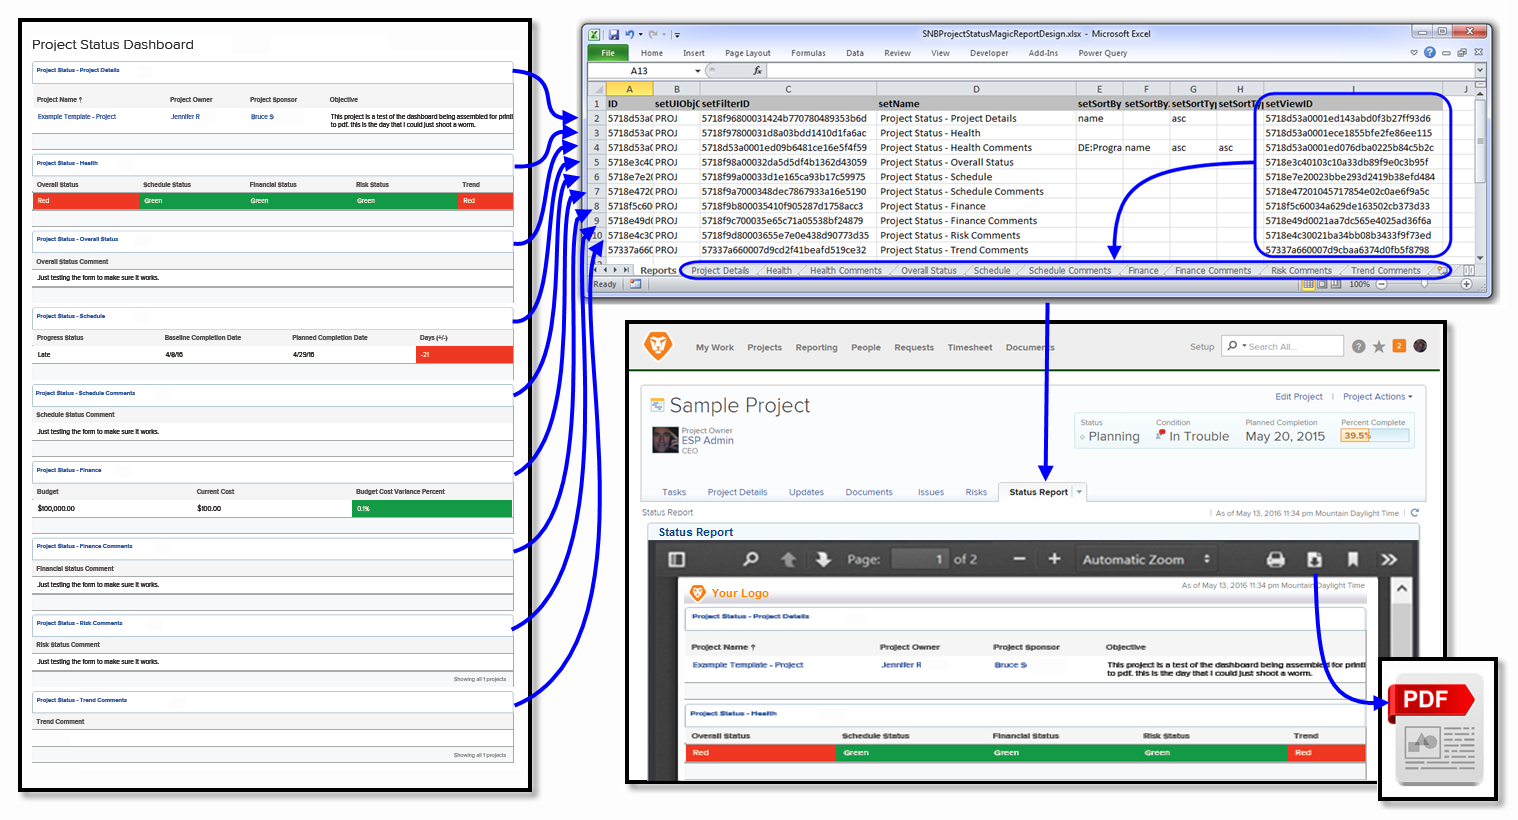
Our Magic Reports solution allows you to engage us to create informative and professional custom reports tailored to your exact specification, maximizing the value of your Workfront data, your images, and your investment.