MarCom Gantt
Set and Manage High Level Plans
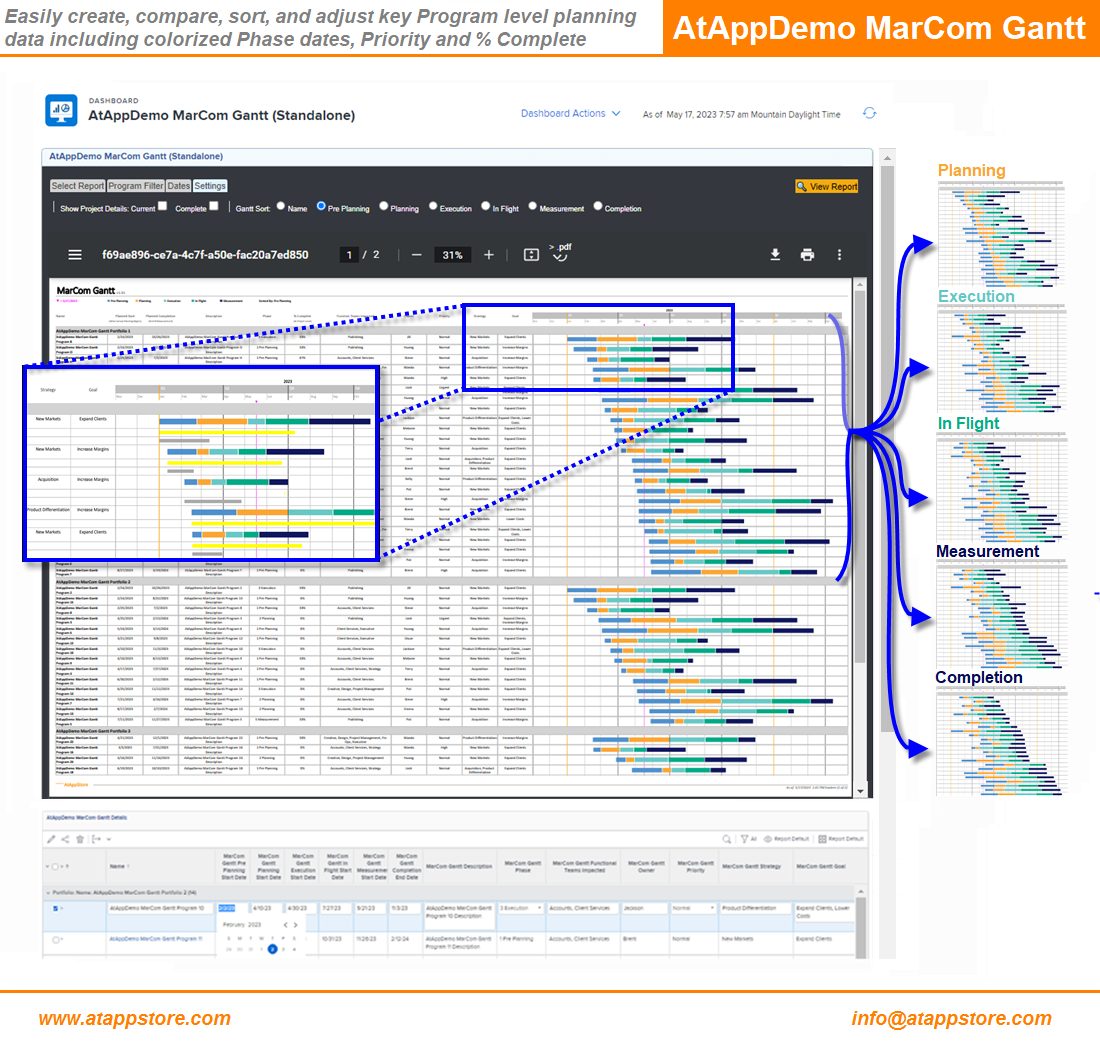
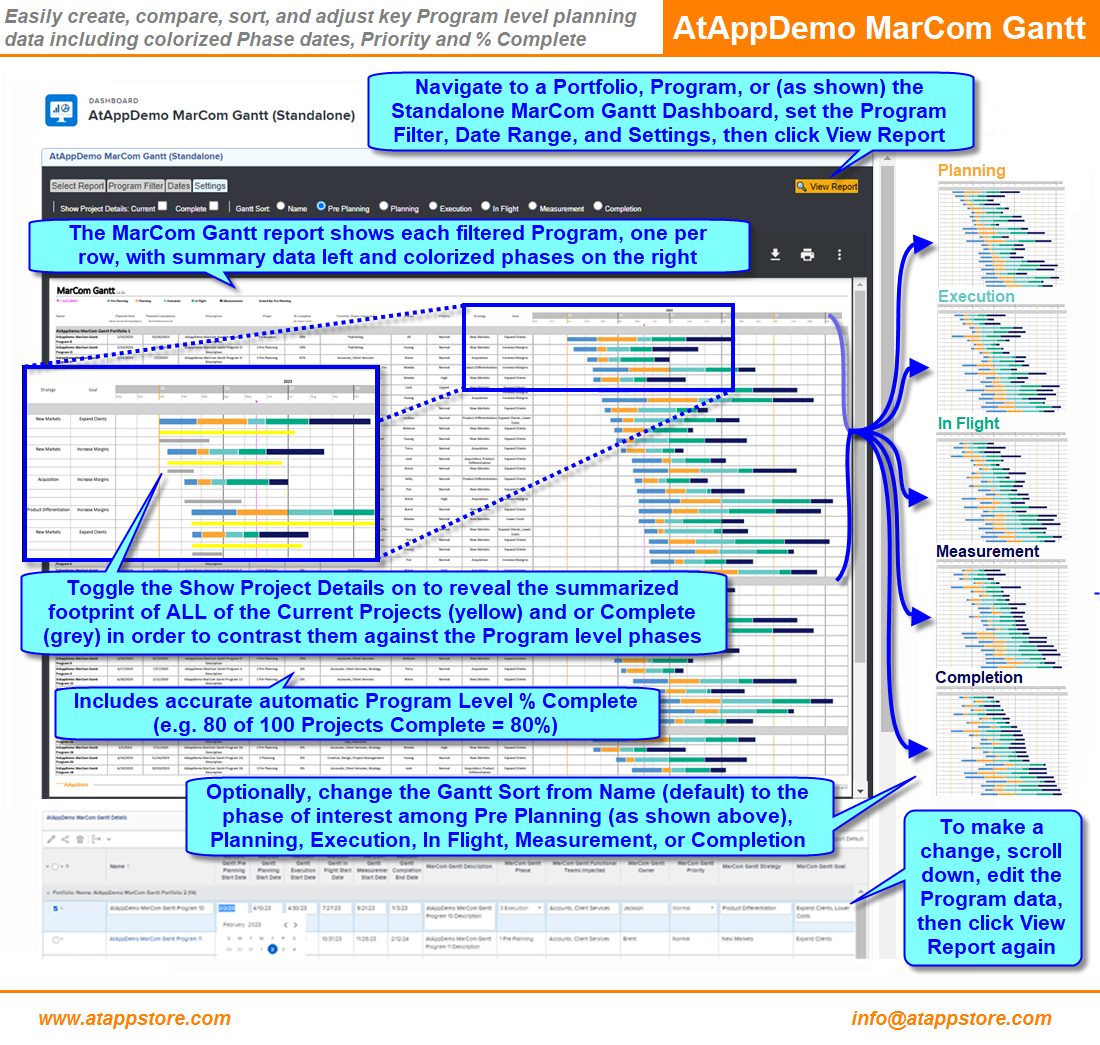
Our MarCom Gantt solution lets you easily create, compare, sort, and adjust key Program level planning data including colorized Phase dates, Priority and % Complete.

Our MarCom Gantt solution lets you easily create, compare, sort, and adjust key Program level planning data including colorized Phase dates, Priority and % Complete.
| HOW | Annual License, Limited Trial, Glossy, Video |
| WHAT | Budgeting, Calendaring, Reporting |
| WHEN | Since 2023 |
| WHERE | Portfolios, Programs, Projects |
| WHO | Executive, Planner |
| WHY | Embedded, Simplification |
Our MarCom Gantt solution lets you easily create, compare, sort, and adjust key Program level planning data including colorized Phase dates, Priority and % Complete.
Our MarCom Gantt solution lets you easily create, compare, sort, and adjust key Program level planning data including colorized Phase dates, Priority and % Complete.
To use it…
We will help you run our “Package Installation” to install our MarCom Gantt solution into your Workfront instance, including the dashboards, Magic Reports, filters, views, and additional custom data against which the report then generates.
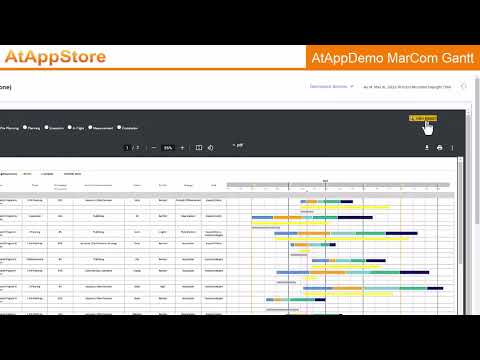
Refer to the MarCom Gantt video in the Media section, which includes a detailed functionality review.
Once installed, the resulting MarCom Gantt solution then provides all of the following:
To then configure it for the Users of interest:
And finally, to test it for the Users of interest:
PRICING
Top
From $9,999/Year (unlimited use)
Since our MarCom Gantt solution is based on our Magic Reports technology, if you’d like us to tailor it to suit your needs exactly, we’d be also happy to discuss a fixed quote to do so.
Other Calendaring Solutions…