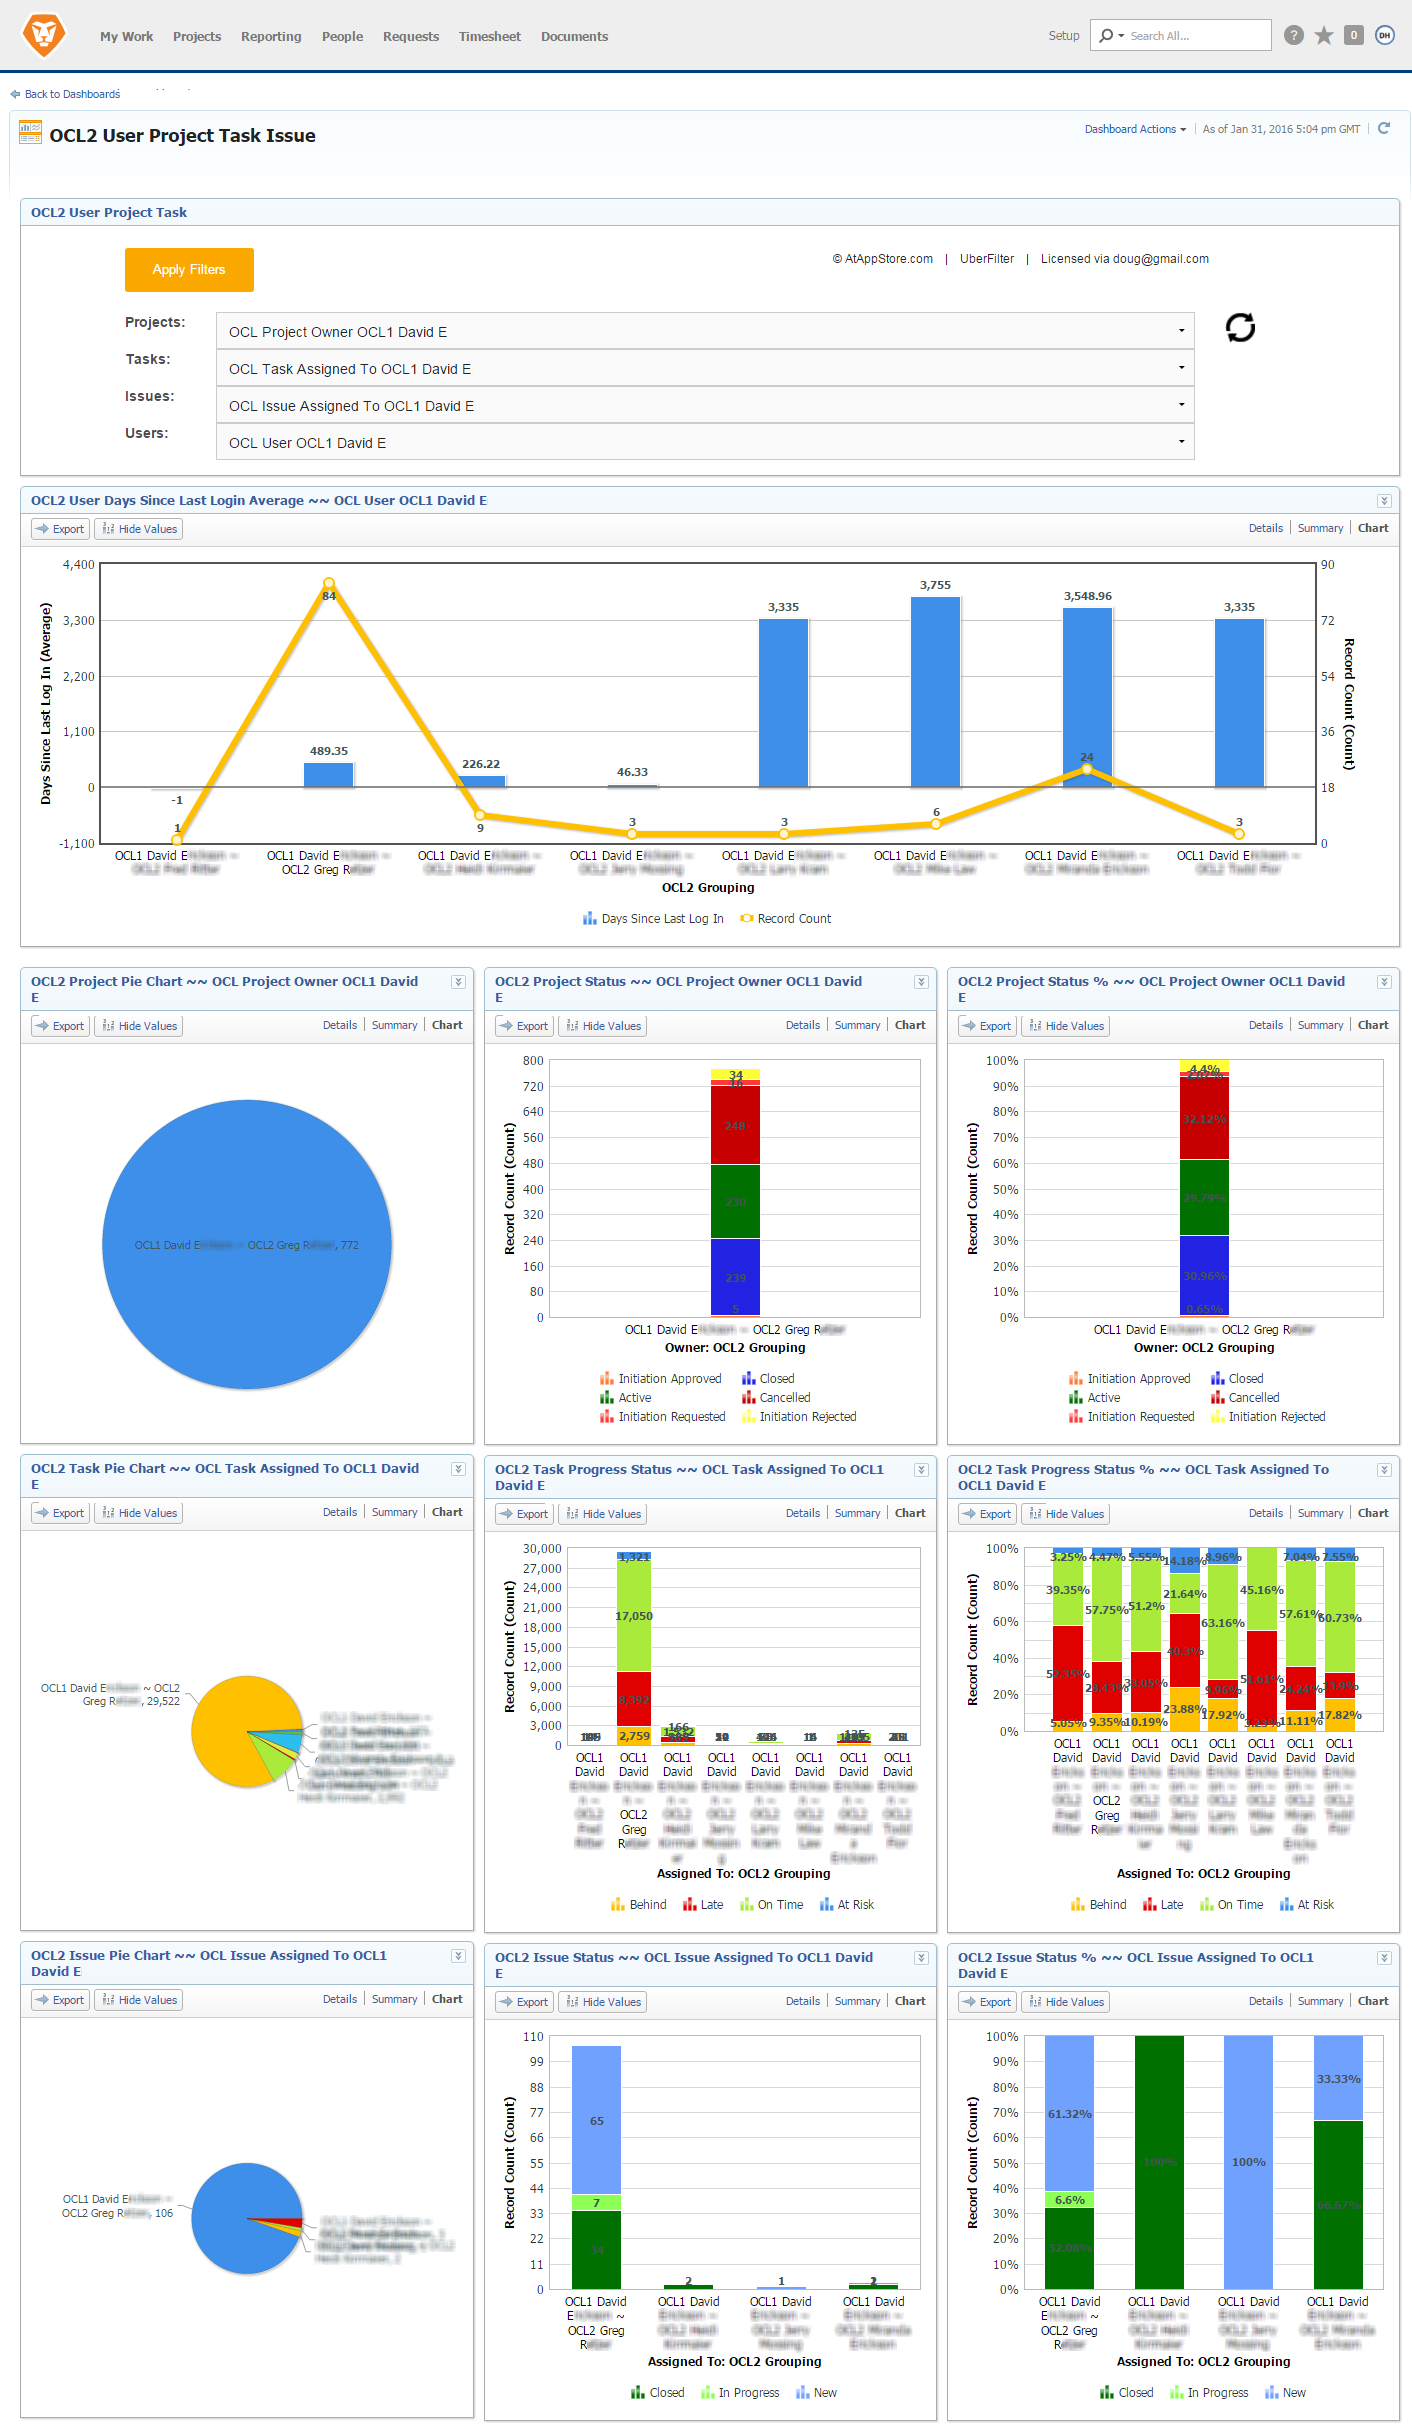
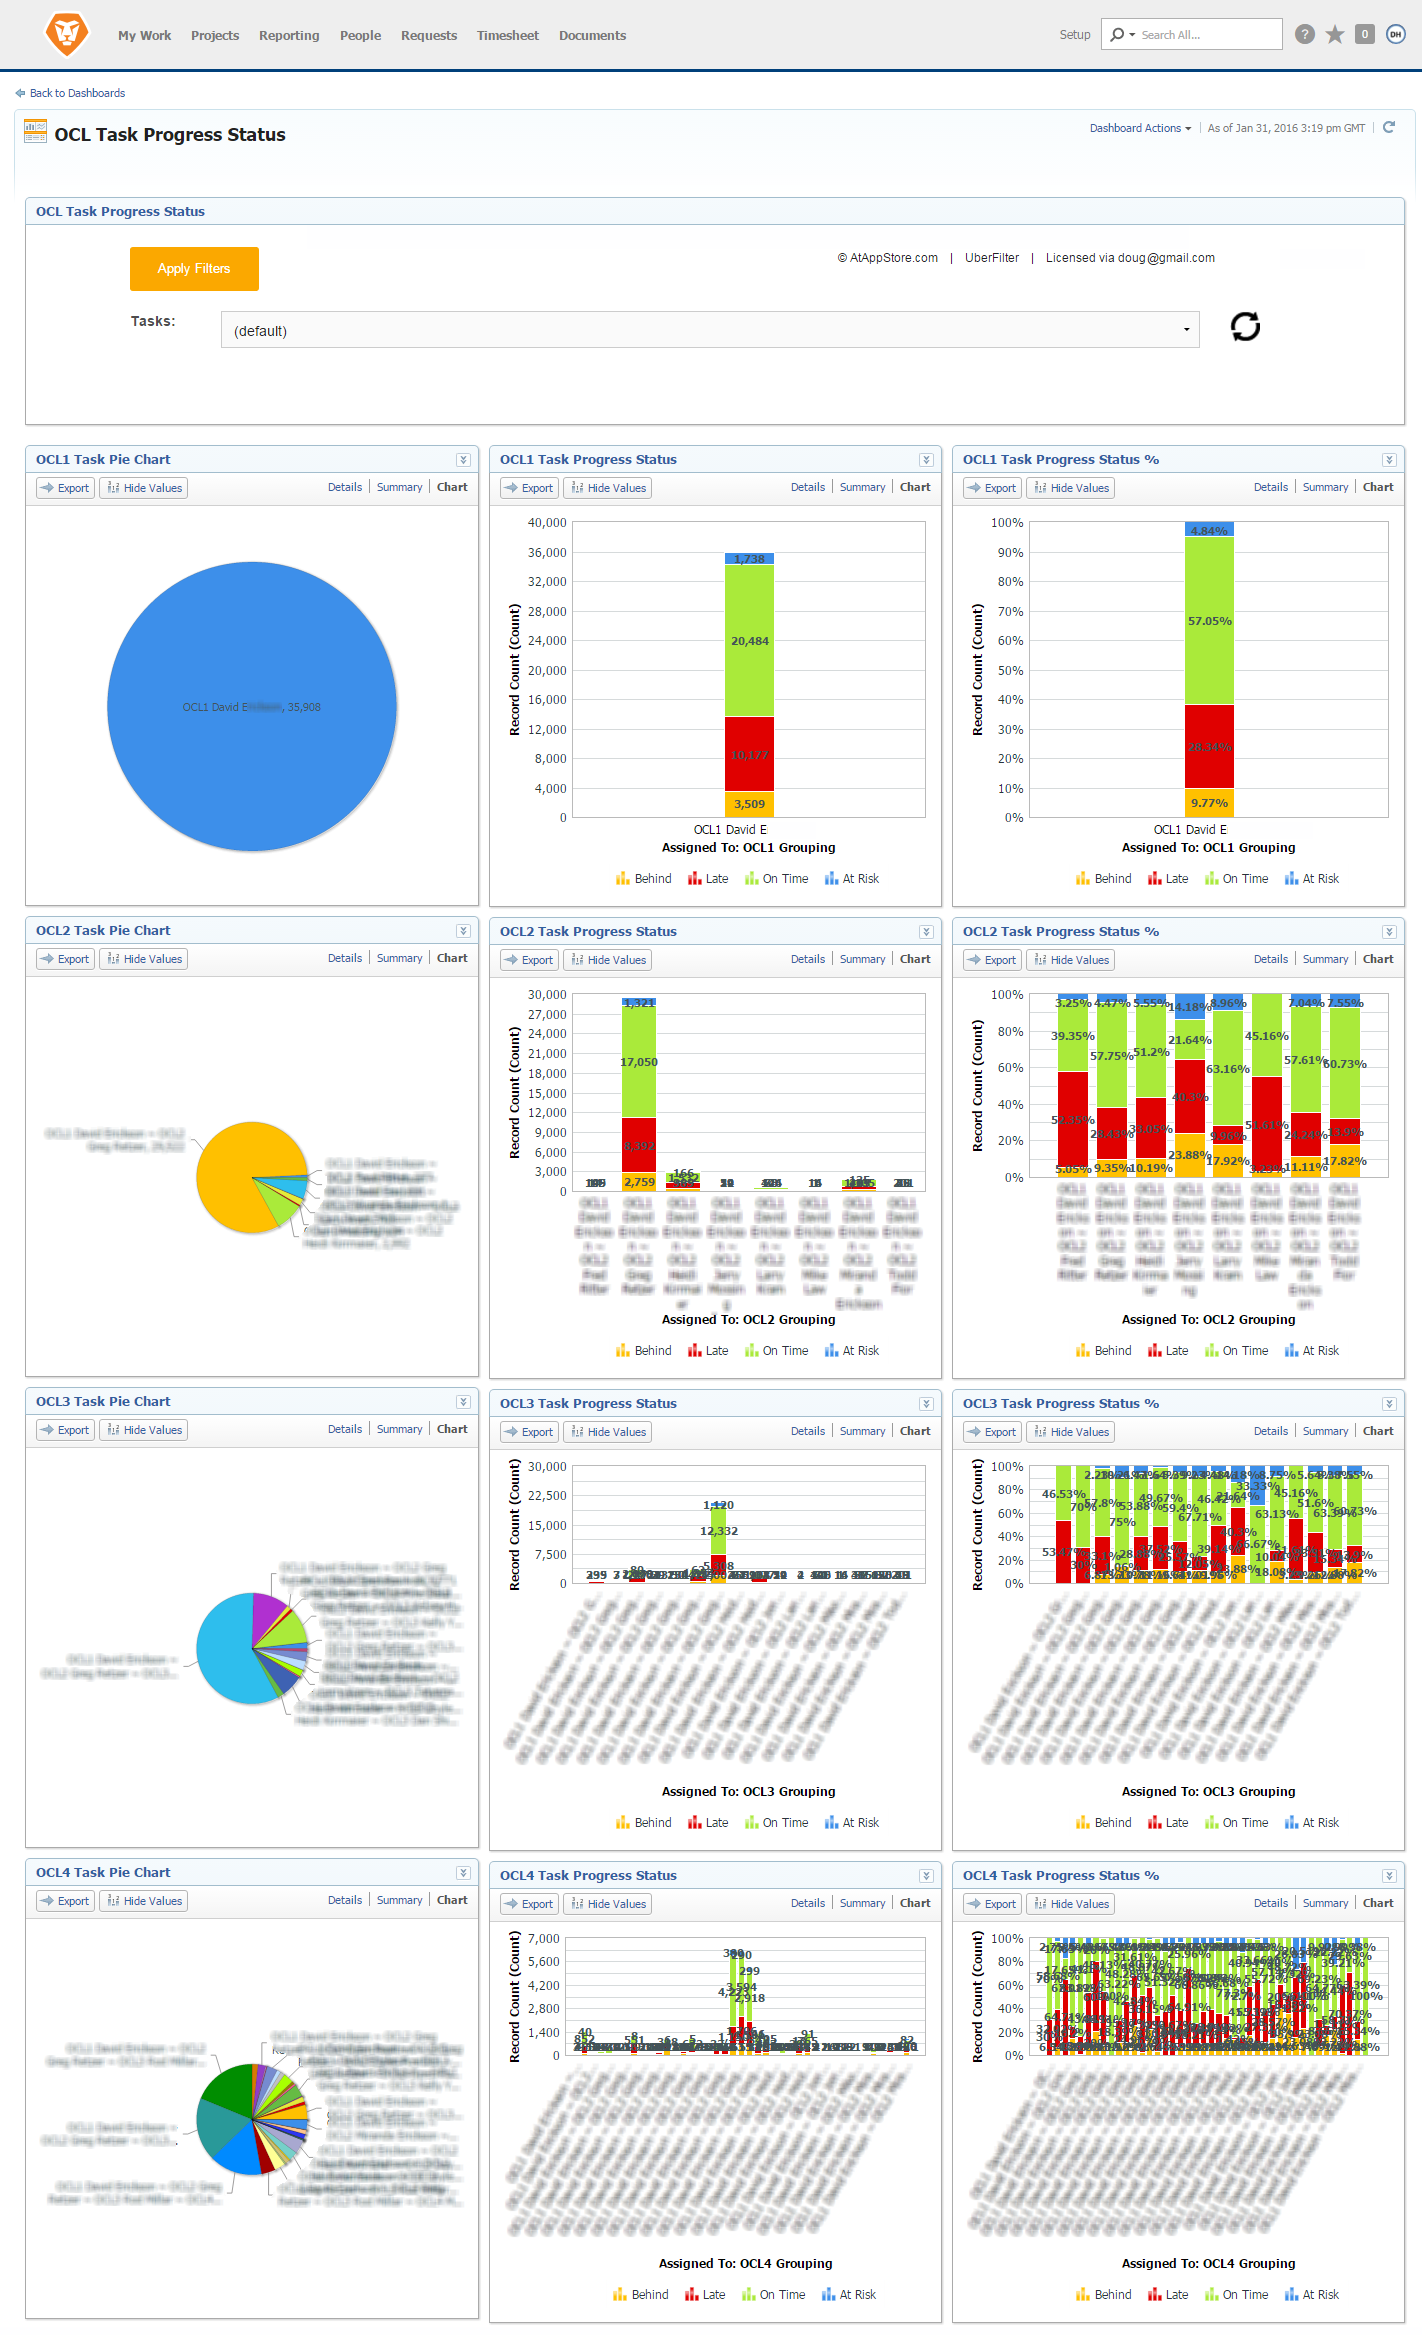
Executive Dashboards
Compete Constructively
Our Executive Dashboards solution allows your executives to easily compare the absolute and relative activity within Workfront across a variety of metrics in a manner designed to improve both productivity and adoption.