UserWatch
Improve Adoption
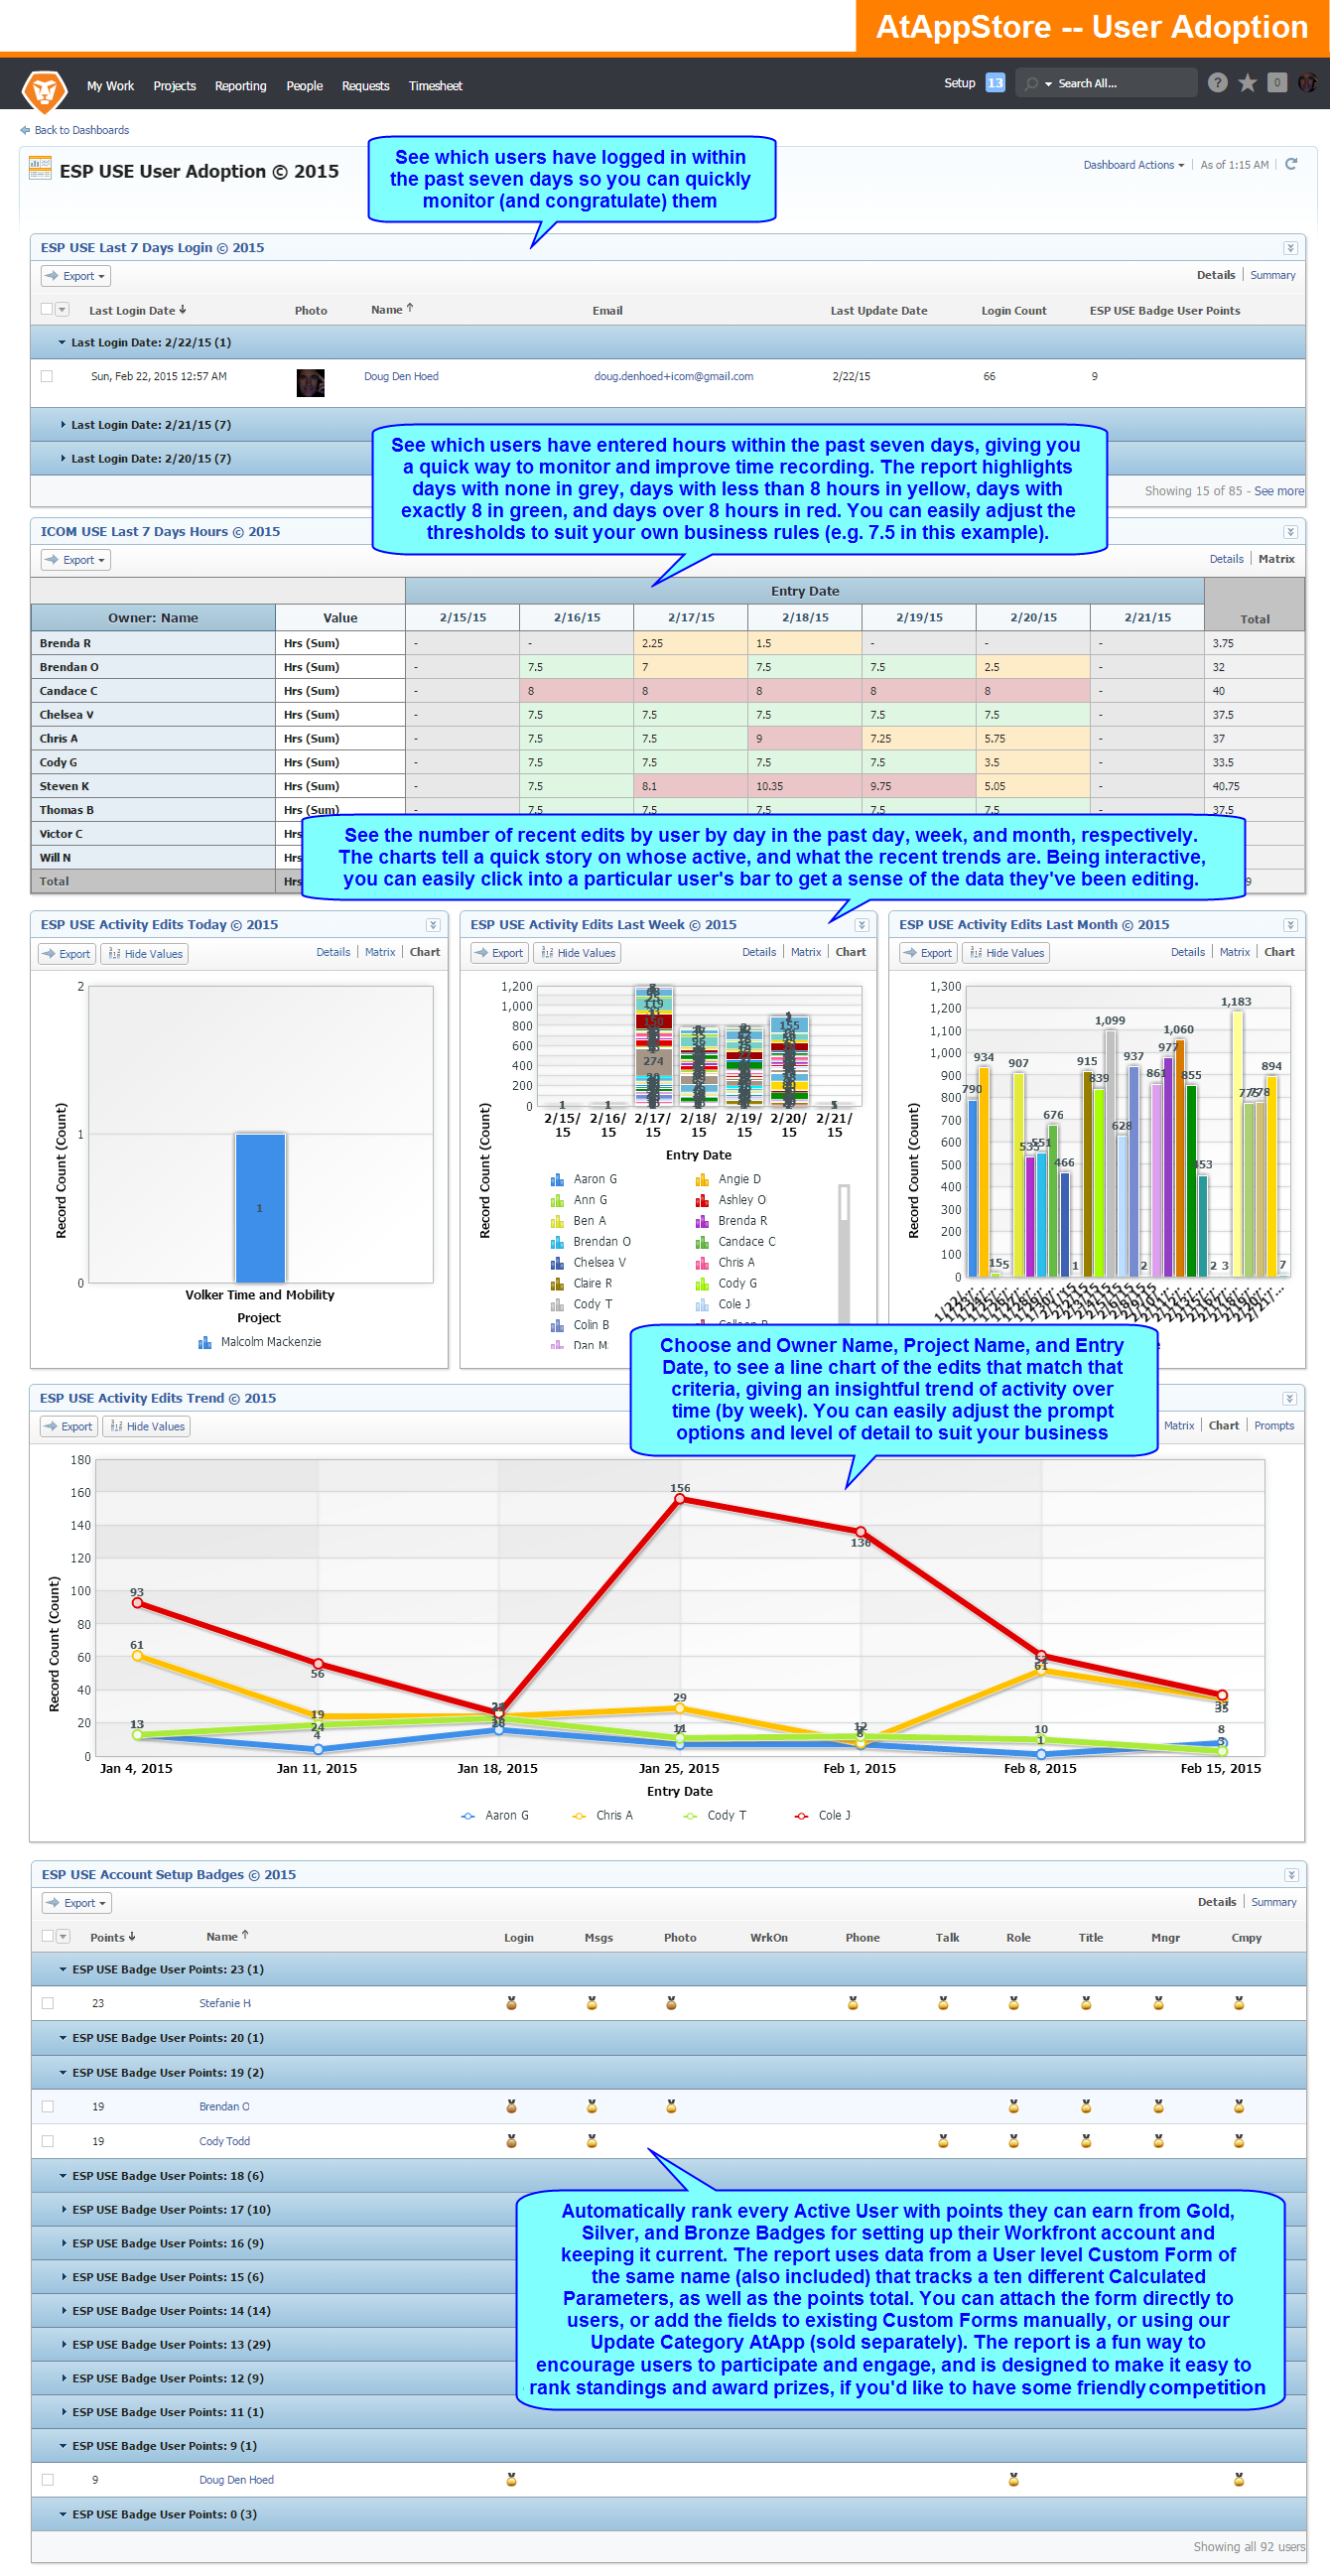
Our UserWatch solution equips you with a set of informative Workfront based reports on a centralized dashboard which you can use to monitor usage and encourage adoption in an easy, transparent, and fun manner.

Our UserWatch solution equips you with a set of informative Workfront based reports on a centralized dashboard which you can use to monitor usage and encourage adoption in an easy, transparent, and fun manner.
| HOW | Image, Purchase |
| WHAT | Configuration, Reporting |
| WHEN | Since 2018 |
| WHERE | Custom Data, Issues, Other, Tasks, Users |
| WHO | Executive, Planner, Worker |
| WHY | Embedded, Simplification |
Our UserWatch solution equips you with a set of informative Workfront based reports on a centralized dashboard which you can use to monitor usage and encourage adoption in an easy, transparent, and fun manner.
Our UserWatch solution equips you with a set of informative Workfront based reports on a centralized dashboard which you can use to monitor usage and encourage adoption in an easy, transparent, and fun manner.
To use it…
Run UserWatch to deploy a Package our informative Dashboard with several reports, including:
PRICING
Top
From $499/Domain (one time fee)
Other Reporting Solutions…


Our Executive Dashboards solution allows your executives to easily compare the absolute and relative activity within Workfront across a variety of metrics in a manner designed to improve both productivity and adoption.
| HOW | Image, Purchase |
| WHAT | Reporting |
| WHEN | Since 2016 |
| WHERE | Issues, Projects, Tasks, Users |
| WHO | Executive, Planner |
| WHY | Embedded, Simplification |

Our Update Category solution allows you to quickly manipulate categories, including adding, removing, and reordering parameters and parameter groups, as well as modifying and validating calculated parameter formulas.
| HOW | Annual License, Image, On Demand |
| WHAT | Configuration |
| WHEN | Since 2013 |
| WHERE | Custom Data |
| WHO | Planner, SysAdmin |
| WHY | Automation, Data Processing, Simplification |